27 Insightful Amazon Seller Statistics (2026 Data)
There are over 1.9 million active sellers on Amazon as of 2026, and they account for 65% of Amazon’s net sales. With 550 new sellers joining the platform each day, Amazon registered just 165,000 new sellers in 2025, the lowest annual total in a decade.
Know the detailed statistics on these sellers in this post. See what works for them and how they are managing their operations on the world's biggest B2C eCommerce marketplace.
Number of Amazon Sellers in 2026
There are 9.7 million registered sellers on Amazon, of which 1.9 million are active as of 2026. This means that only 19.6% of Amazon’s registered sellers are active.
A total of 165,000 new sellers joined the Amazon marketplace in 2025 alone, averaging about 550 new sellers each day. This is the lowest annual total since Marketplace Pulse began tracking in 2015, down 44% from 2024. Traffic per active seller has risen 31% since 2021, meaning fewer sellers are competing for more opportunity.
Among these new sellers, 29% cite their goal as using Amazon to grow their existing business.
Source: Helium10
Number of Amazon third-party sellers
61% of paid units on Amazon were sold by third-party sellers in 2025, which accounts for approximately 1.9 million active third-party sellers on the platform. These third-party sellers use Seller Central to sell on Amazon.
Seller Central is a platform for third-party sellers who list and sell their products directly to customers on Amazon. These sellers manage their own inventory, set prices, and handle customer service.
Vendor Central is a platform for first-party sellers who sell their products directly to Amazon. Amazon then sells these products to customers. Vendors work with Amazon as suppliers and often receive bulk orders from Amazon.

Source: Jungle Scout
Amazon sellers in the United States sold 5 billion items last year
Amazon sellers based in the United States sold more than 5 billion items in 2025, that’s an average selling of 8,600 items every minute and an average of more than $375,000 in annual sales.
Source: Amazon.
61% of Amazon’s sales come via third party sellers
Third-party sellers accounted for 61% of Amazon’s paid units as of 2025. Amazon registered net sales of $55.39 billion in Q2 2024, out of which $36.20 billion came from third-party sellers. Most of these sellers are small and medium-sized businesses.
Third-party sellers accounted for 42% of total sales on Amazon a decade ago. By Q4 2024, the third-party unit share reached an all-time high of 62%.
Amazon sellers in the United States employ 2 million people
Selling on Amazon’s platform drives economic growth in local communities across the U.S. Independent sellers on Amazon have created over 2 million jobs nationwide. These positions include roles involved in managing, operating, and supporting the efforts of sellers who use Amazon’s marketplace.
Amazon’s independent sellers have helped people advance in their careers and learn new skills, supporting economic growth and inclusion across many industries in the country.
Source: Amazon
Amazon sellers from the United States exported 580 million items in 2025
U.S.-based sellers shipped over 580 million items to customers in more than 130 countries in 2025. Many consumers claim that Amazon makes it easier to reach international customers by offering a range of helpful tools and services.
Sellers said they benefited from Amazon’s advanced shipping and logistics system and features like automatic translation of product listings and currency conversion to simplify selling in different countries.
Source: Amazon
71% of Amazon sellers source their products from China
71% of Amazon sellers sourced their products from China in 2023. Chinese sellers also are a big part of Amazon's third-party services and ads. However, Amazon wants to change this exchange. The eCommerce giant has an ambitious goal to import $20 billion worth of products from India by 2025.
This shows that Amazon is increasingly confident in India's ability to supply goods and sees it as a key player in its global sourcing plans.
Source: eStore Factory.
60% of Amazon sellers are omnichannel sellers
60% of Amazon sellers are also selling their products on other platforms. eBay remains the favorite alternate marketplace for Amazon sellers with 23% of Amazon sellers selling on the platform. Shopify and Walmart round up to second and third position with 21% and 19% votes respectively.
Amazon sellers are also selling products on social media, this growth is fueled by the launch of TikTok shop and growth of Facebook marketplace.
Source: Jungle Scout
84% of all businesses on Amazon advertise their products
Utilizing Amazon promo codes can be an effective strategy for sellers to boost visibility and attract more customers.
84% of businesses on Amazon use ads to promote their products, either on Amazon or other sites. For small businesses and sellers, online platforms are the top choice for advertising, with 58% investing in pay-per-click (PPC) ads.
| Ad type | Share of Amazon sellers using it |
| Amazon PPC ads | 58% |
| Social media ads | 42% |
| Search engine ads | 34% |
| Traditional media | 7% |
| None of the above | 17% |
Source: Jungle Scout.
Amazon sellers ad spending statistics
68% of small businesses and sellers on Amazon spend between $0 and $2,500 a month on advertising. Only 2% of Amazon SMBs spend over $25,000 to advertise their products.
| Ad spend | Share of Amazon Sellers |
| Less than $500 | 47% |
| $501 to $2,500 | 21% |
| $2,501 to $5,000 | 9% |
| $5,001 to $7,500 | 6% |
| $7,501 to $10,000 | 4% |
| $10,001 to $25,000 | 3% |
| $25,000 to $50,000 | 1% |
| $50,001 to $100,000 | 1% |
- Almost half (47%) of small businesses and sellers spend less than $500 a month on advertising through Amazon.
- Rising ad costs worry 38% of all Amazon sellers, brands, and businesses.
- Managing pay-per-click (PPC) ads is one of the biggest challenges for small business sellers.
Source: Jungle Scout.
Challenges For Amazon Sellers
Amazon businesses of all sizes faced similar problems. The biggest issue was rising shipping costs, with 38% of enterprise brands and 44% of small and medium businesses saying it was their top concern.
Beyond that, their priorities were different. Enterprise brands were also worried about the rising cost of goods and inflation, both named by 34%. For small and medium businesses, the next biggest issues were increasing ad costs at 40%, stronger competition at 32%, and market saturation at 32%.
All types of Amazon sellers from large brands to smaller businesses shared the same top 10 concerns. Most of these were about rising costs. Storage fees, shipping, ads, and goods are all getting more expensive. Doing business on Amazon now costs more, and companies of every size are feeling the pressure.
Source: Jungle Scout Report.
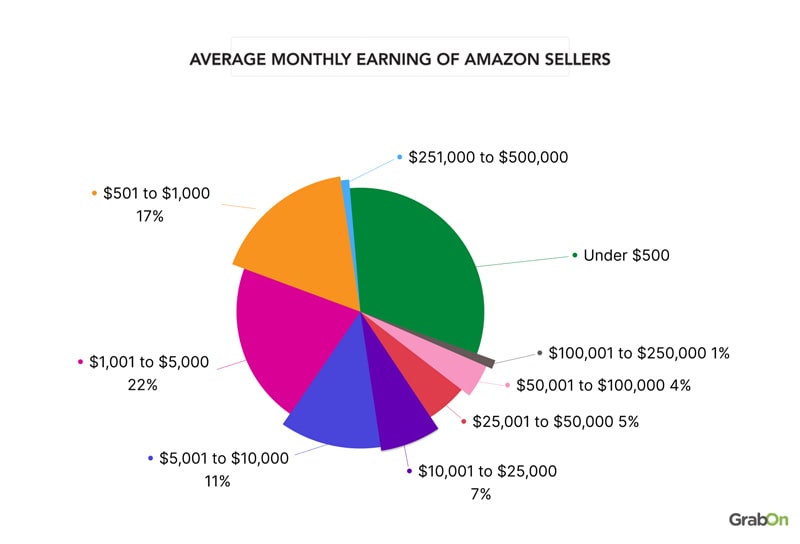
Average monthly earning of Amazon sellers
70% of Amazon sellers make less than $10,000 every month and only 6% are able to cross the $50,000 mark. 24% of small- and medium-sized businesses Amazon sellers have reached lifetime sales of over $100,000 in 2023.
| Monthly | Percent of sellers |
| Under $500 | 31% |
| $501 to $1,000 | 17% |
| $1,001 to $5,000 | 22% |
| $5,001 to $10,000 | 11% |
| $10,001 to $25,000 | 7% |
| $25,001 to $50,000 | 5% |
| $50,001 to $100,000 | 4% |
| $100,001 to $250,000 | 1% |
| $251,000 to $500,000 | 1% |
Source: JS.
Most profitable categories for Amazon sellers
About one-third of sellers in the beauty and personal care category are very profitable, with a net margin of 21% or more.
Home and kitchen products are just as profitable, with 30% of sellers in this category also making net margins of 21% or higher. It's the most popular category on Amazon, with 35% of sellers offering home and kitchen items.
Clothing, shoes, jewelry, arts and crafts, and electronics also have good profitability, with margins over 20%.
| Product category | Share of profitable sellers |
| Beauty and personal care | 30% |
| Home and kitchen | 30% |
| Clothing shoes and jewelry | 27% |
| Arts, crafts and sewing | 23% |
| Electronics | 22% |
| Sports and outdoors | 21% |
| Health, household and babycare | 21% |
| Toys and games | 20% |
| Groceries and gourmet food | 19% |
| Cell phones and accessories | 17% |
Source: ECDB
The majority of Amazon sellers are using AI tools for their listings
Over 1.3 million Amazon’s sellers have used generative AI tools to create product listings. Most sellers are using these AI-generated listings and making only small changes, accepting suggested details about 90% of the time.
Previously, 75% of sellers said that creating ad designs and picking the right format were their biggest challenges.
Source: Amazon.
86% of Amazon sellers use the FBA program
On Amazon, 86% of sellers use Fulfillment by Amazon (FBA) to handle their orders, and those who switch to FBA typically see their sales increase by over 2,000%. Another option, Fulfillment by Merchant (FBM), is chosen by 34% of sellers, although its use has dropped by 9% over the past year.
Additionally, 22% of sellers use a mix of both FBA and FBM to manage their sales.
Source: Jungle Scout.
AI Usage of Amazon Sellers
34% of Amazon Sellers user AI tools to write and optimize product listings, another 14% use it for creating marketing and social media content.
Here is a table showing how Amazon Sellers use AI tools.
| Writing and optimizing listings | 34% |
| Creating marketing and social media content | 14% |
| Keywords and SEO research | 7% |
| Customer service | 6% |
| Product images | 6% |
| Product research | 6% |
Source: Statista.
Amazon sellers statistics on Amazon Prime Day
- Amazon Prime Day 2025 expanded to four days (July 8 to 11), generating an estimated $24.1 billion in total US online spending, the biggest Prime Day in Amazon’s history. Independent sellers achieved record sales and a record number of items sold.
- Merchants who participated in Prime Day had 10x more Buy with Prime orders daily and their revenue from these orders increased 8x compared to the month before Prime Day was announced.
Amazon Seller Statistics by State (2026)
Independent sellers in the U.S. sold more than 4.5 billion items in the previous year, thats an average of 8,600 items every minute. Additionally, more than 10,000 independent sellers on Amazon surpassed $1 million in sales for the first time during the same period.
Let’s break down this amazing feat of Amazon sellers by state in this section:
Alabama
- 3000 independent Sellers.
- $150,000 average annual sales.
- 14 million items sold.
Alaska
- 400 independent sellers.
- $25,000 average annual sales.
- 300,000 items sold.
Arizona
- 9,500 independent sellers.
- $155,000 average annual sales.
- 43 million items sold.
Arkansas
- 1,500 independent sellers.
- $120,000 average annual sales.
- 8 million items sold.
California
- 77,000 independent sellers.
- $290,000 average annual sales.
- 715 million items sold.
Colorado
- 8,500 independent sellers.
- $200,000 average annual sales.
- 63 million items sold.
Connecticut
- 5,000 independent sellers.
- $215,000 average annual sales.
- 47 million items sold.
Delaware
- 2,500 independent sellers.
- $660,000 average annual sales.
- 47 million items sold.
Florida
- 56,000 independent sellers.
- $195,000 average annual sales.
- 358 million items sold.
Georgia
- 16,000 independent sellers.
- $145,000 average annual sales.
- 72 million items sold.
Hawaii
- 1,000 independent sellers.
- $70,000 average annual sales.
- 4 million items sold.
Idaho
- 2,000 independent sellers.
- $190,000 average annual sales.
- 16 million items sold.
Illinois
- 15,000 independent sellers.
- $250,000 average annual sales.
- 131 million items sold.
Indiana
- 5,500 independent sellers.
- $190,000 average annual sales.
- 35 million items sold.
Iowa
- 2,000 independent sellers.
- $210,000 average annual sales.
- 14 million items sold.
Kansas
- 2,500 independent sellers.
- $200,000 average annual sales.
- 13 million items sold.
Kentucky
- 3,000 independent sellers.
- $175,000 average annual sales.
- 22 million items sold.
Louisiana
- 3,000 independent sellers.
- $120,000 average annual sales.
- 19 million items sold.
Maine
- 1,000 independent sellers.
- $165,000 average annual sales.
- 9 million items sold.
Maryland
- 8,000 independent sellers.
- $140,000 average annual sales.
- 34 million items sold.
Massachusetts
- 9,000 independent sellers.
- $245,000 average annual sales.
- 92 million items sold.
Michigan
- 11,000 independent sellers.
- $200,000 average annual sales.
- 62 million items sold.
Minnesota
- 5,500 independent sellers.
- $270,000 average annual sales.
- 50 million items sold.
Mississippi
- 1,500 independent sellers.
- $70,000 average annual sales.
- 3 million items sold.
Missouri
- 5,500 independent sellers.
- $210,000 average annual sales.
- 40 million items sold.
Montana
- 1,000 independent sellers.
- $125,000 average annual sales.
- 3 million items sold.
Nebraska
- 1,000 independent sellers.
- $540,000 average annual sales.
- 11 million items sold.
Nevada
- 6,000 independent sellers.
- $255,000 average annual sales.
- 49 million items sold.
New Hampshire
- 1,500 independent sellers.
- $260,000 average annual sales.
- 12 million items sold.
New Jersey
- 20,000 independent sellers.
- $420,000 average annual sales.
- 294 million items sold.
New Mexico
- 1,500 independent sellers.
- $50,000 average annual sales.
- 3 million items sold.
New York
- 37,000 independent sellers.
- $495,000 average annual sales.
- 721 million items sold.
North Carolina
- 11,000 independent sellers.
- $175,000 average annual sales.
- 64 million items sold.
North Dakota
- 400 independent sellers.
- $235,000 average annual sales.
- 4 million items sold.
Ohio
- 11,000 independent sellers.
- $230,000 average annual sales.
- 76 million items sold.
Oklahoma
- 2,500 independent sellers.
- $100,000 average annual sales.
- 8 million items sold.
Oregon
- 5,500 independent sellers.
- $185,000 average annual sales.
- 31 million items sold.
Pennsylvania
- 13,000 independent sellers.
- $185,000 average annual sales.
- 87 million items sold.
Rhode Island
- 1,000 independent sellers.
- $140,000 average annual sales.
- 4 million items sold.
South Carolina
- 4,500 independent sellers.
- $110,000 average annual sales.
- 17 million items sold.
South Dakota
- 600 independent sellers.
- $315,000 average annual sales.
- 5 million items sold.
Tennessee
- 6,000 independent sellers.
- $245,000 average annual sales.
- 56 million items sold.
Texas
- 39,000 independent sellers.
- $170,000 average annual sales.
- 204 million items sold.
Utah
- 7,000 independent sellers.
- $465,000 average annual sales.
- 111 million items sold.
Vermont
- 600 independent sellers.
- $250,000 average annual sales.
- 6 million items sold.
Virginia
- 11,000 independent sellers.
- $165,000 average annual sales.
- 45 million items sold.
Washington
- 10,000 independent sellers.
- $450,000 average annual sales.
- 487 million items sold.
Washington, D.C.
- 800 independent sellers.
- $75,000 average annual sales.
- 3 million items sold.
West Virginia
- 700 independent sellers.
- $105,000 average annual sales.
- 2 million items sold.
Wisconsin
- 5,000 independent sellers.
- $240,000 average annual sales.
- 35 million items sold.
Wyoming
- 2,500 independent sellers.
- $115,000 average annual sales.
- 12 million items sold.
Source: Amazon.