US Aviation Statistics: Data On America’s Air Travel Market (2026)

Think about the massive US aviation market. It handles over 3 million passengers every single day. That’s almost 44,000 flights covering 29 million square miles of airspace! Airlines pack in millions of seats monthly. Take the busy New York JFK to Los Angeles route for example, that books 301,200 seats a month alone. Even the largest airline in the US, American Airlines offered 20.7 million seats in November 2025. Now, these numbers show the scale of operation in the US, putting the US aviation market at $86.72 billion in 2025. In this article, we will shed light on the crucial US aviation data such as market share, passenger counts, airport rankings, and other trends.
US Aviation Statistics Top Picks
- The US Aviation market is valued at $86.72 billion as of 2025.
- The United States handles approximately 44,360 flights per day.
- American Airlines has the most amount of share in the US commercial aviation market with 21% hold.
- The United States has approximately 19,482 airports as of 2025. Of this, 5,146 are public airports, while 14,366 are private airports.
- Hartsfield Jackson Atlanta International (ATL) remains the world’s and United State's busiest airport as of 2025.
United States Aviation Market Size
The US aviation market is valued at $86.72 billion in 2025, and it’s projected to reach $105 billion by 2030, growing at a compound annual growth rate (CAGR) of 3.9% over the forecast period.

| Market Segment | 2025 Value | 2030 Projection | CAGR | Market Share |
| Total US Aviation Market | $86.72 billion | $105.00 billion | 3.9% | 100% |
| Civil and Commercial | $55.93 billion | $67.65 billion | 3.9% | 64.4% |
| Military Aviation | $24.80 billion | $31.34 billion | 4.79% | 28.6% |
| General Aviation (North America) | $21.37 billion | $24.01 billion | 2.35% | 7% |
Commercial aviation holds 64.45% of the total US aviation market. The civil and commercial segment is projected to grow from $55.93 billion in 2025 to $67.65 billion by 2030.
Military aviation represents the fastest-growing segment at 4.79% CAGR, supported by Department of Defense procurement programs like the Next Generation Air Dominance (NGAD) and B-21 Raider initiatives. The United States maintains 39% of worldwide military expenditure.
General aviation in North America stands at $21.37 billion in 2025, projected to reach $24.01 billion by 2030 at a 2.35% CAGR. North America accounts for 69% of worldwide business jet deliveries, with the United States holding approximately 90% of the region’s operational business jet fleet. The sector contributes approximately $150 billion annually to the U.S. economy alone, supported by 57 million high-net-worth individuals (HNWIs) in the region.
Fleet modernization drives significant spending. Airlines continue upgrading cabins and redirecting capacity toward leisure-heavy domestic routes, keeping load factors high and spurring replacement demand for fuel-efficient aircraft. Boeing filed multiple autonomy-related patents in 2024, signaling future single-pilot or remotely supervised commercial-flight concepts.
Labor constraints inflate costs, pilot wages increased 45% and mechanic hourly rates rose 32%, reducing fleet utilization. Despite these pressures, the industry generated over $60 billion annually in revenues from the top airlines in 2025, with a passenger base exceeding 700 million available seats during peak travel seasons.
Source: Mordor Intelligence, Spherical Insights, Research and Markets
How Many Flights Per Day in the US
The United States handles approximately 44,360 flights per day. These flights cover commercial airlines, private aircraft, cargo operations, and military movements across 29.4 million square miles of airspace, which is the largest, most complex, and busiest air traffic management structure globally.
At peak operational times, there are simultaneously around 5,500 flights in the sky.
Source: Federal Aviation Administration
How Many Commercial Flights Per Day in the US
There are approximately 28,000 to 30,000 commercial flights per day under normal operational conditions in the United States. This number fluctuated significantly during 2020 due to COVID-19, dropping to an average of 19,000 flights per day, but has since recovered to exceed pre-pandemic levels in 2024-2025.
US airlines specifically operate around 25,000 commercial flights per day, with foreign carriers accounting for the remainder of commercial operations. During peak travel periods, these numbers surge.
Here are a few examples below:
- Thanksgiving 2024: The week recorded 232,000 flights, making it the busiest Thanksgiving travel week on record. This averages 33,143 flights per day during that seven-day perioda 47% increase over baseline.
- July 4th 2025: American Airlines alone planned 71,000 flights from June 27 through July 7 (11 days), averaging 6,455 flights daily from a single carrier.
US Airlines Market Share
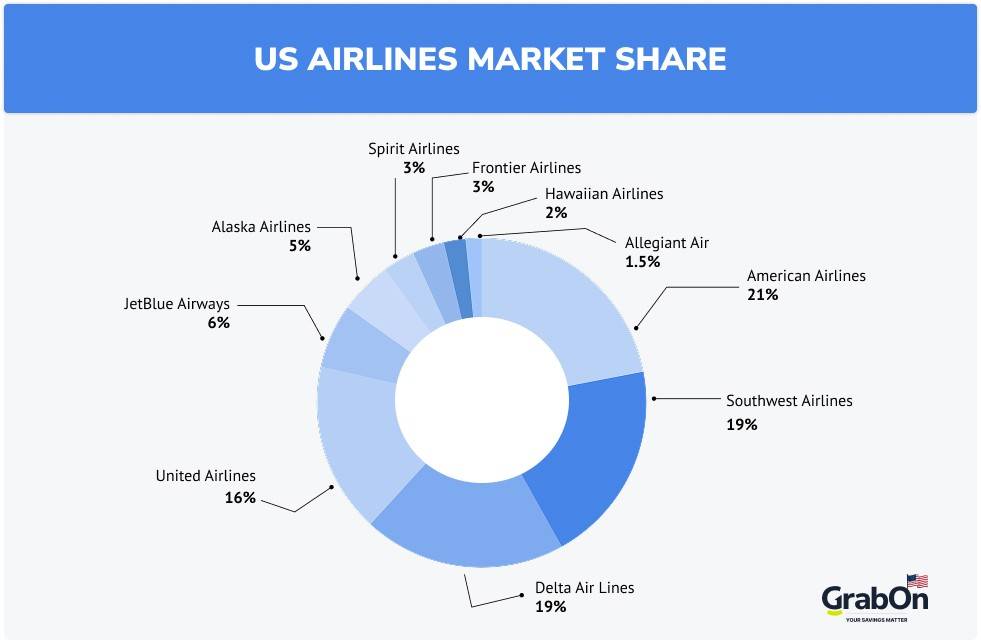
American Airlines has the most amount of share in the US commercial aviation market with 21% hold. The next two in line are Southwest Airlines and Delta Air Lines, with a 19% market hold each.
The US airline industry demonstrates high concentration in 2025, with the Big Four carriers, American Airlines, Delta Air Lines, Southwest Airlines, and United Airlines, controlling approximately 75% of domestic capacity.
| Rank | Airline | Market Share | Monthly Seats (Million) |
| 1 | American Airlines | 21% | 20.7 million |
| 2 | Southwest Airlines | 19% | 18.6 million |
| 3 | Delta Air Lines | 19% | 18.4 million |
| 4 | United Airlines | 16% | 15.8 million |
| 5 | JetBlue Airways | 6% | 5.9 million |
| 6 | Alaska Airlines | 5% | 4.9 million |
| 7 | Spirit Airlines | 3% | 3.0 million |
| 8 | Frontier Airlines | 3% | 3.0 million |
| 9 | Hawaiian Airlines | 2% | 2.0 million |
| 10 | Allegiant Air | 1.5% | 1.5 million |
American Airlines remains the biggest carrier in the US with 21% market share and 20.7 million seats in November 2025. The airline added 862,500 more seats compared to November 2024, leading all carriers in absolute seat growth. American serves approximately 200 million passengers annually and generated revenues near $53 billion in 2024. The carrier operates thousands of daily flights from major hubs, including Dallas/Fort Worth, Charlotte, Chicago O’Hare, and Phoenix, with over 500,000 passengers per day passing through American Airlines flights on average.
Southwest Airlines and Delta Air Lines essentially tie for second place, each representing 19% market share with 18.6 million and 18.4 million seats, respectively. Southwest holds the distinction as the largest low-cost carrier, connecting over 100 destinations and flying approximately 150 million passengers in 2025 with revenues near USD 25 billion. The carrier’s customer-centric policiesno change fees and free checked bags, along with point-to-point route systems effectively serve leisure travelers. However, Southwest experienced a 7.9% reduction in flight operations in November 2024 versus the previous year, representing capacity adjustments balancing operational costs with profitability.
Delta Air Lines serves approximately 200 million passengers annually with 2025 revenues estimated at around $50 billion. Delta’s operational stability and premium service positioning maintain strong business and leisure travel demand.
United Airlines captures 16% of domestic airline capacity with major hubs at Chicago O’Hare, Newark, Denver, Houston, and San Francisco. Serving around 140 million passengers annually, United’s 2025 revenues reached approximately USD 40 billion. The airline added 797,200 seats in November 2025 versus November 2024, the second-largest absolute increase behind American. United emphasizes fleet modernization with fuel-efficient aircraft and invests heavily in technology to enhance digital engagement.
Source: OAG, Spherical Insights, Airlines for America
Number of Domestic Flights In US Over the Years
| Year | Total Domestic Flights (Millions) | Average Daily Flights |
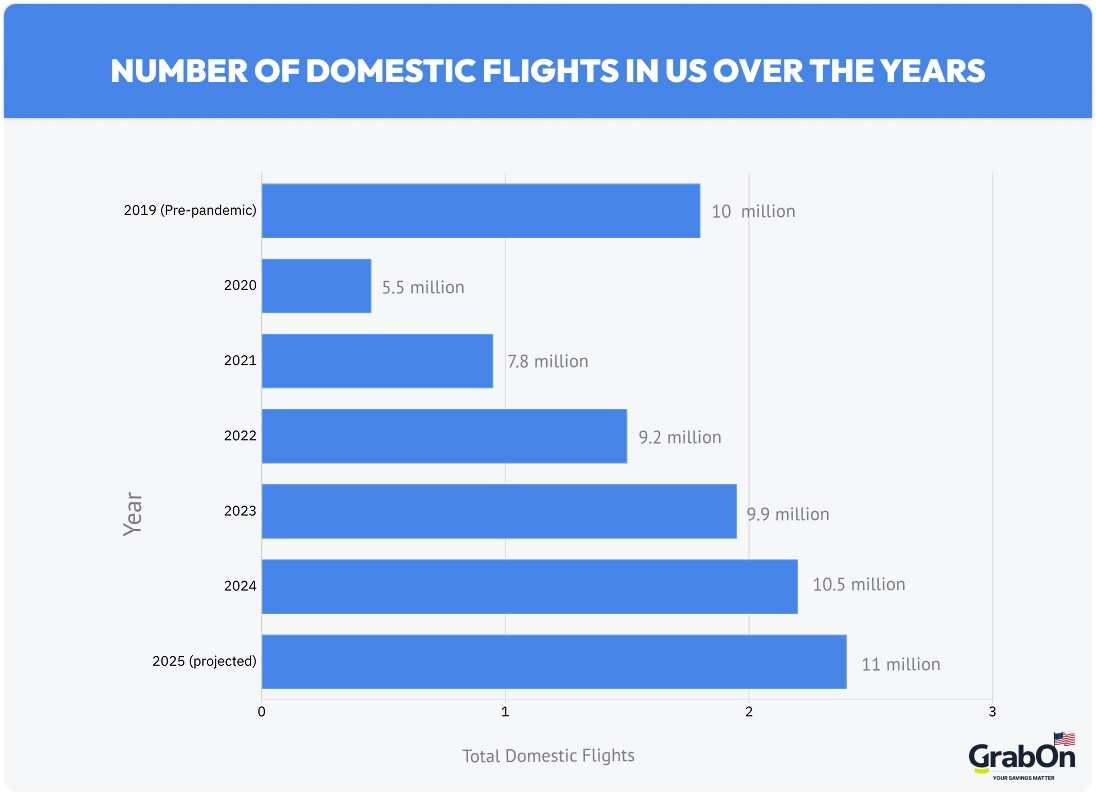
| 2019 (Pre-pandemic) | 10 million | 27,400 |
| 2020 | 5.5 million | 15,070 |
| 2021 | 7.8 million | 21,370 |
| 2022 | 9.2 million | 25,200 |
| 2023 | 9.9 million | 27,120 |
| 2024 | 10.5 million | 28,770 |
| 2025 | 11 million | 30,140 |
2020 marked the lowest point in this decade so far, with domestic flights dropping 45% year-over-year to approximately 5.5 million total flights (15,070 daily average). April 2020 specifically saw daily flights plummet to historic lows, with some days recording fewer than 5,000 flights, an 82% reduction from typical operations.
Recovery began in Q2 2021 as vaccine rollout proceeded rapidly. Passenger throughput started climbing steadily, with TSA safety checks exceeding two million in a single day for the first time in the COVID era on June 11, 2021. Throughout summer 2021, the daily average hovered around two million passengers, trailing 2019 numbers by roughly 500,000 daily. By the end of 2021, domestic flights reached 7.8 million annuallystill 22% below 2019 but representing 42% year-over-year growth from 2020’s nadir.
2022 saw continued acceleration with 9.2 million domestic flights (+18% versus 2021), narrowing the gap with 2019 to just 8%. The rebound reflected pent-up leisure demand, business travel resumption, and airlines restoring pre-pandemic route networks.
2023 domestic operations totaled 9.9 million flights, achieving near-complete recovery at 99% of 2019 levels. Daily averages of 27,120 flights matched pre-pandemic norms.
2024 surpassed pre-pandemic operations with 10.5 million domestic flights (+6.1% versus 2023), averaging 28,770 daily flights5% above 2019. The year recorded multiple historic highs, including Thanksgiving week’s record 232,000 flights and consistent summer daily volumes exceeding 30,000.
2025 projections suggest continued growth to approximately 11.0 million domestic flights, averaging 30,140 daily operations, representing a 10% increase over 2019 baseline.
Source: FAA, BTS, Airlines for America
Number of International Flights In US Over the Years
| Year | Total International Flights | Average Daily Flights |
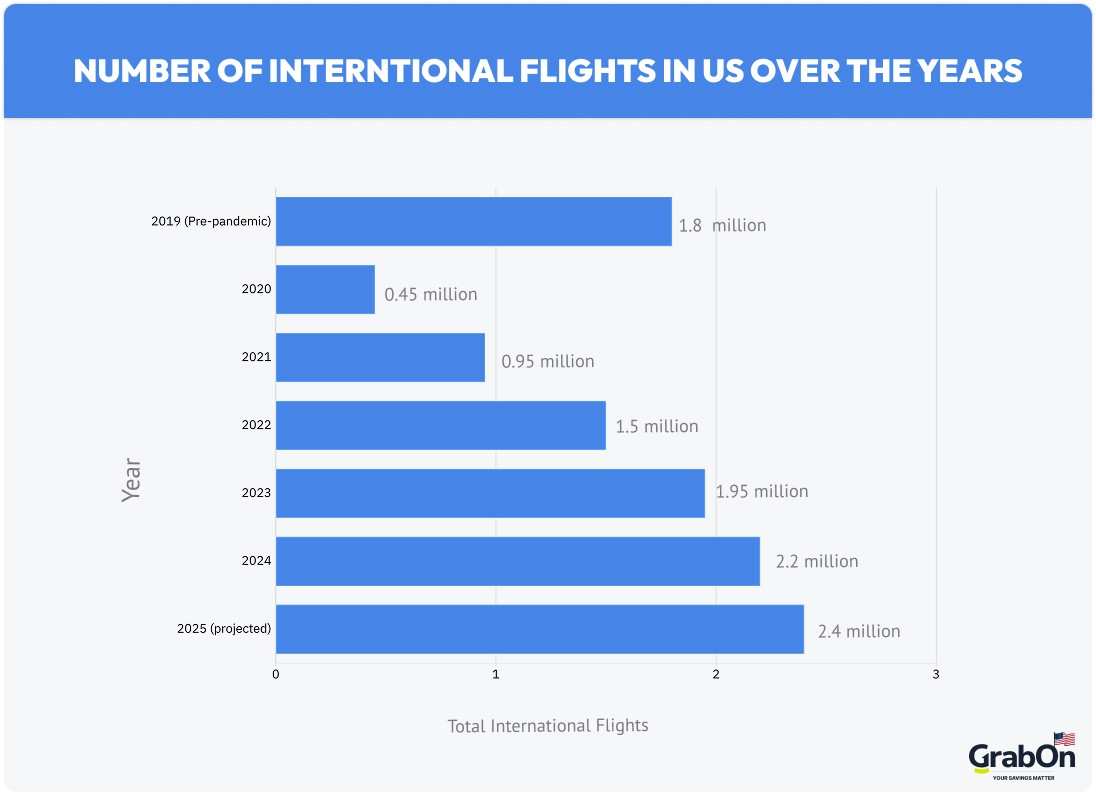
| 2019 (Pre-pandemic) | 1.8 million | 4,932 |
| 2020 | 0.45 million | 1,233 |
| 2021 | 0.95 million | 2,603 |
| 2022 | 1.5 million | 4,110 |
| 2023 | 1.95 million | 5,342 |
| 2024 | 2.2 million | 6,027 |
| 2025 | 2.4 million | 6,575 |
International operations collapsed more severely than domestic ones during the pandemic. 2020 international flights totaled approximately 450,000, a devastating 75% decline from 2019’s 1.8 million. Border closures, quarantine requirements, and travel restrictions essentially shut down global mobility. April 2020 saw revenue passenger kilometers (RPK) decline 98.4% on all international routes.
Recovery began later than domestic, with 2021 international flights reaching 950,000 (+111% year-over-year but still 47% below 2019). International borders remained restricted through much of 2021, particularly for leisure travel.
2022 marked the inflection point with 1.5 million international flights, recovering to 83% of 2019 levels. The 58% year-over-year growth reflected border reopenings, easing travel restrictions, and resumption of business travel.
2023 operations reached 1.95 million flights, surpassing 2019 by 8.3%. International demand recovered faster than expected, driven by pent-up desire for overseas leisure travel and normalization of business relationships.
2024 continued expansion with 2.2 million international flights (+12.8% versus 2023), placing international operations 22% above pre-pandemic levels, a significantly faster recovery rate than domestic’s 5% growth over the same period. Daily international flights averaged 6,027, compared to 4,932 in 2019.
2025 projections suggest 2.4 million international flights, averaging 6,575 daily operations, representing a 33% increase over 2019 baseline.
Top International Country Markets from the US (2024-2025)
| Rank | Country | Annual Passengers |
| 1 | Mexico | 45 million |
| 2 | Canada | 28 million |
| 3 | United Kingdom | 18 million |
| 4 | Dominican Republic | 12 million |
| 5 | Japan | 9 million |
| 6 | Germany | 7 million |
| 7 | France | 7 million |
| 8 | South Korea | 6 million |
| 9 | China | 5 million |
| 10 | Jamaica | 5 million |
Mexico dominates as the largest international market with approximately 45 million annual passengers, accounting for roughly 16% of all international travel. The Mexico-USA corridor is the largest international country pair globally, with geographic proximity, extensive business ties, large diaspora populations, and strong tourism flows in both directions driving demand.
Canada ranks second with 28 million annual passengers, benefiting from the world’s longest international border, integrated economies, and similar cultural ties that make cross-border travel routine for business and leisure.
China dropped significantly from pre-pandemic rankings (formerly #2-3) to #9 with only 5 million passengers in 2024-2025, representing approximately 60% recovery from 2019 levels. Geopolitical tensions, restrictive Chinese COVID policies extending into 2023, and reduced business travel have all contributed to slower recovery on the trans-Pacific route.
Source: BTS, DOT T-100 Reports, FAA
How Many Airports in the US
The United States has approximately 19,482 airports as of 2025. Of this, 5,146 are public airports, while 14,366 are private airports. This represents the largest airport network of any nation globally, roughly three times more than the second place Brazil’s 4,919 airports and more than all European Union countries combined.
Breakdown by Airport Type
| Airport Category | Number | Percentage | Description |
| Total Airports | 19,482 | 100% | All landing facilities |
| Public-Use Airports | 5,146 | 26.4% | Open to the general public |
| Private-Use Airports | 14,336 | 73.6% | Restricted access |
Public-use airports number 5,146 and include both commercial service airports and general aviation facilities accessible to the public. This category has declined slightly since 1990, when approximately 5,600 public-use airports operated, representing a net loss of about 400 facilities over 35 years due to closures, consolidation, and economic pressures.
Private-use airports comprise the vast majority at approximately 14,336 facilities (73.6% of total). This category has increased in recent years, driven by growth in corporate aviation, agricultural aviation, and private pilots building personal airstrips. Many are small grass strips serving single aircraft or small operations.
United States Airports By States
Texas leads all states with over 1,400 airports, roughly 7% of the national total. Texas’s combination of large land area, oil industry aviation needs, agricultural aviation requirements, and major urban centers like Houston, Dallas, and Austin drives this concentration.
Other states with extensive airport networks:
- Alaska: 550 airports (essential for remote community access where roads don’t exist)
- California: 500 airports (population, economic activity, general aviation culture)
- Illinois: 403 airports (aviation manufacturing heritage, agricultural aviation)
- Florida: 400 airports (tourism, retirees, general aviation)
- Pennsylvania: 390 airports (industrial heritage, dispersed population)
Airport Operational Intensity
While 19,700 airports exist, operational intensity concentrates dramatically. The top 10 airports handle approximately 35% of all passenger traffic. The top 30 airports account for roughly 70% of passengers. The top 100 airports capture approximately 95% of all commercial passenger traffic.
This means approximately 400+ airports handle the remaining 5% of commercial traffic, while the other 19,000+ facilities serve general aviation, cargo, military, and private operations with minimal or zero scheduled passenger service.
The FAA’s Air Traffic Organization manages operations across this network with over 14,000 air traffic controllers coordinating departures, landings, and in-flight movements to prevent collisions and minimize delays.
Source: FAA, BTS, World Airport Codes, POI Data
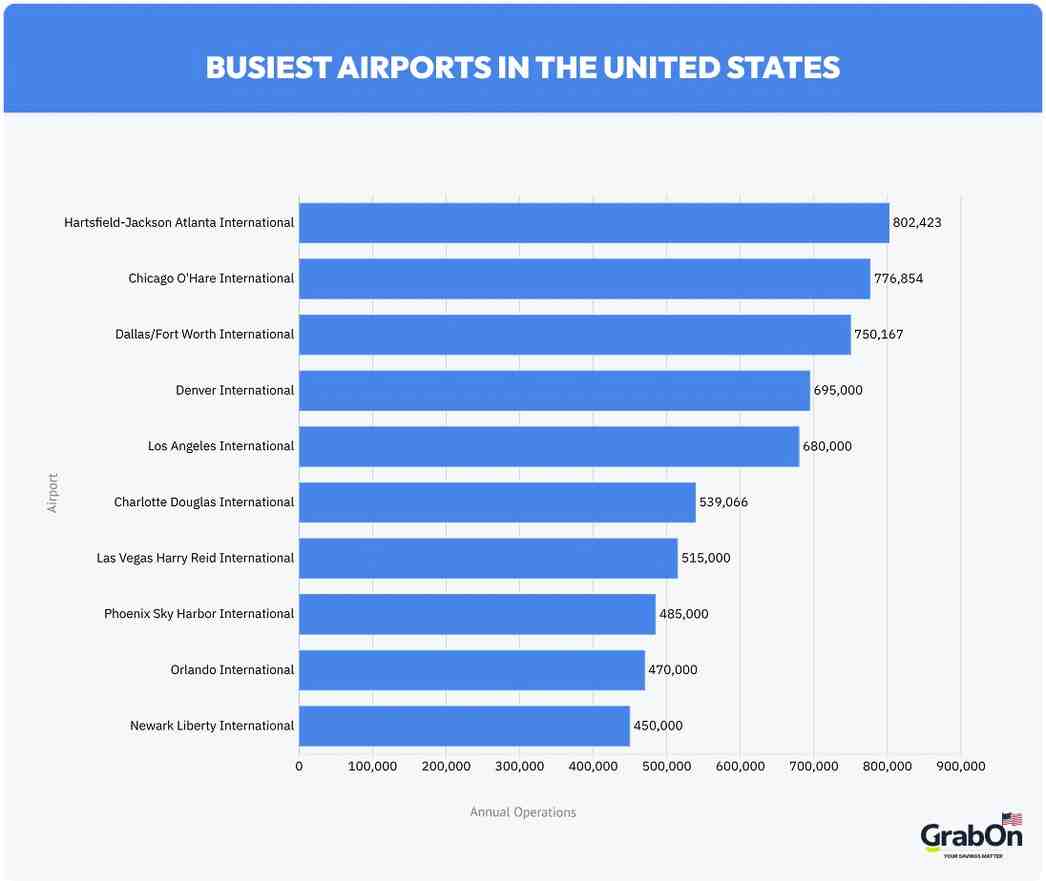
Busiest Airports in the United States
| Rank | Airport | Annual Operations | Daily Average | Annual Passengers |
| 1 | Hartsfield-Jackson Atlanta International | 802,423 | 2,198 | 104.6 million |
| 2 | Chicago O’Hare International | 776,854 | 2,128 | 83.3 million |
| 3 | Dallas/Fort Worth International | 750,167 | 2,055 | 81.8 million |
| 4 | Denver International | 695,000 | 1,904 | 77.8 million |
| 5 | Los Angeles International | 680,000 | 1,863 | 87.5 million |
| 6 | Charlotte Douglas International | 539,066 | 1,477 | 57.5 million |
| 7 | Las Vegas Harry Reid International | 515,000 | 1,411 | 57.6 million |
| 8 | Phoenix Sky Harbor International | 485,000 | 1,329 | 48.8 million |
| 9 | Orlando International | 470,000 | 1,288 | 53.7 million |
| 10 | Newark Liberty International | 450,000 | 1,233 | 47.5 million |
Hartsfield-Jackson Atlanta International (ATL) remains the world’s busiest airport for the fifth year in a row, handling 802,423 operations in 2024approximately 21,000 more than in 2023. Atlanta averages 2,198 aircraft movements daily, processing one takeoff or landing every 39 seconds during peak operations. The airport served 104.6 million passengers in 2024, maintaining its position as the highest-traffic airport globally.
Atlanta’s dominance stems from its role as Delta Air Lines’ primary hub, geographic positioning in the southeastern US enabling efficient connections across the country, and massive terminal capacity with six runways capable of handling 250+ simultaneous flights. The airport’s passenger-to-operation ratio is 130 passengers per operation, indicating efficient use of larger aircraft.
Chicago O’Hare (ORD) ranks second with 776,854 operations (2,128 daily), processing 83.3 million passengers. O’Hare added 28,000 more operations versus 2023the largest absolute increase among top airports. The airport serves as a major hub for United Airlines and American Airlines, with its Midwest location providing natural geographic centrality for East-West connections. O’Hare’s passenger-to-operation ratio is 107 passengers per operation.
Dallas/Fort Worth (DFW) rounds out the top three with 750,167 operations (2,055 daily) and 81.8 million passengers. As American Airlines’ largest hub, DFW benefits from Texas’s population growth, strong economy, and central location. The airport added 18,000 operations versus 2023. DFW’s passenger-to-operation ratio is 109 passengers per operation.
Charlotte Douglas (CLT) showed the highest percentage growth among top-10 airports, increasing operations 14.6% year-over-year. From January to June 2024, CLT recorded 264,516 aircraft movements, placing it on pace to surpass 540,000 annual operationsa significant jump from 539,066 in 2023. Charlotte’s growth reflects American Airlines’ hub expansion and the southeastern US’s robust population and economic growth.
Las Vegas (LAS) experienced a 6.5% decline in operations to approximately 515,000, reflecting reduced leisure demand post-pandemic boom and airline capacity adjustments. Nevada overall decreased capacity by 293,200 seats in November 2025 versus November 2024, heavily impacting Las Vegas’s leisure-focused aviation market.
Top 10 Busiest US Airports by Capacity (November 2025)
| Rank | Airport | Code | Monthly Seats | Market Share |
| 1 | Atlanta (ATL) | ATL | 5.1 million | 5.0% |
| 2 | Dallas/Fort Worth (DFW) | DFW | 4.5 million | 4.4% |
| 3 | Chicago O’Hare (ORD) | ORD | 4.2 million | 4.1% |
| 4 | Denver (DEN) | DEN | 3.9 million | 3.8% |
| 5 | Los Angeles (LAX) | LAX | 3.7 million | 3.6% |
| 6 | Phoenix (PHX) | PHX | 2.9 million | 2.8% |
| 7 | Charlotte (CLT) | CLT | 2.8 million | 2.7% |
| 8 | Las Vegas (LAS) | LAS | 2.6 million | 2.5% |
| 9 | Newark (EWR) | EWR | 2.5 million | 2.4% |
| 10 | San Francisco (SFO) | SFO | 2.4 million | 2.3% |
The top 10 busiest airports make up 35.3% of total US seat capacity, demonstrating significant concentration of operations. Atlanta maintains its lead with 5.1 million monthly seats, representing 5.0% of the nation’s total capacity.
Chicago O’Hare recorded the largest absolute capacity increase, adding 491,500 seats in November 2025 versus November 2024. This growth positions O’Hare for potential advancement in rankings. Illinois overall added 471,700 seatsthe largest state-level increasewith O’Hare driving nearly all of that growth.
Charlotte (CLT) posted the highest percentage growth at +12%, reflecting aggressive expansion by American Airlines and the airport’s increasing role as a southeastern connector.
Las Vegas (LAS) decreased capacity by 287,400 seatsthe largest absolute decline among top 10 airports and the second consecutive month of capacity reduction. Nevada’s heavy reliance on leisure travel combined with economic pressures and staffing challenges drove carriers to redirect capacity toward more profitable routes.
Source: FAA, OAG, BTS
Busiest Domestic Routes in the United States
US domestic routes connect major population and economic centers, with transcontinental and hub-to-hub routes dominating traffic.
Top 10 Busiest US Domestic Routes (November 2025)
| Rank | Route | Monthly Seats | Daily Flights |
| 1 | New York JFK – Los Angeles (LAX) | 301,200 | 1,003 |
| 2 | New York LaGuardia (LGA) – Chicago (ORD) | 297,900 | 993 |
| 3 | Atlanta (ATL) – Orlando (MCO) | ~285,000 | 950 |
| 4 | Los Angeles (LAX) – San Francisco (SFO) | ~270,000 | 900 |
| 5 | Denver (DEN) – Las Vegas (LAS) | ~255,000 | 850 |
| 6 | Atlanta (ATL) – Fort Lauderdale (FLL) | ~245,000 | 817 |
| 7 | New York (EWR) – Orlando (MCO) | ~240,000 | 800 |
| 8 | Dallas/Fort Worth (DFW) – Houston (IAH) | ~235,000 | 783 |
| 9 | Los Angeles (LAX) – Las Vegas (LAS) | ~225,000 | 750 |
| 10 | Boston (BOS) – Fort Lauderdale (FLL) | ~220,000 | 733 |
New York JFK to Los Angeles remains the busiest airline route in the US with 301,200 seats in November 2025, averaging approximately 1,003 daily flights when accounting for return service. This route increased capacity 10% versus November 2024 (adding roughly 27,500 seats). The transcontinental route connects the nation’s two largest metropolitan areas and serves business travelers, entertainment industry connections, and leisure tourists. Six major carriers operate this route with premium configurations including lie-flat business class.
New York LaGuardia to Chicago O’Hare ranks second with 297,900 seats, recording the largest percentage increase at 16% (adding approximately 41,000 seats versus November 2024). This growth is particularly notable given LaGuardia’s ongoing reconstruction and capacity constraints. The route connects financial centers (New York) with Midwest business hubs (Chicago) and averages 993 daily flights. The LaGuardia-Chicago route consistently ranks among the world’s busiest by flight frequency.
Atlanta to Orlando captures third place with approximately 285,000 seats (~950 daily flights), increasing 8% year-over-year. This leisure-focused route serves Disney World, Universal Studios, and Florida’s theme park corridor from the southeastern hub. Delta dominates this route from its Atlanta base, with Southwest, Spirit, and Frontier providing low-cost competition.
Los Angeles to San Francisco operates approximately 900 daily flights with 270,000 monthly seats (+5% year-over-year). Despite being one of the shortest routes in the top 10 at just 1 hour 30 minutes flight time, the LA-SF corridor serves as a critical intra-California business and tech industry shuttle. United, Alaska, American, Delta, and Southwest all operate hourly departures during business hours.
Two routes showed capacity declines:
Los Angeles to Las Vegas decreased 14% to 225,000 seats (losing approximately 37,000 seats versus November 2024). Honolulu to Kahului (not in top 10) also declined 14%, reflecting broader leisure market softness and capacity reallocation.
Denver to Chicago experienced a dramatic 21% capacity reduction, dropping it from the top 10 entirely to 38th busiest route. United Airlines, which dominates both Denver and Chicago hubs, made strategic capacity reductions on this hub-to-hub route while maintaining or increasing capacity on more profitable spoke routes from each hub.
Four routes involve Florida destinations (Orlando, Fort Lauderdale) in the top 10, reflecting Florida’s dominance as a leisure and retirement destination driving consistent demand year-round.
Source: OAG, Airlines for America
How Many Planes Take Off a Day
With approximately 45,000 flights per day and aircraft operating multiple flight segments daily, roughly 9,000 to 15,000 unique at least once per day in the United States.
Flight Segments per Aircraft per Day
Commercial aircraft utilization varies by route network and aircraft type:
| Aircraft Category | Average Daily Flight Segments | Daily Flight Hours | Annual Utilization |
| Narrow-body (Domestic) | 4-6 segments | 8-12 hours | 3,000-4,200 hours |
| Wide-body (International) | 1-2 segments | 10-16 hours | 3,500-5,500 hours |
| Regional jets | 5-7 segments | 7-10 hours | 2,500-3,500 hours |
| Short-haul Shuttle | 6-8 segments | 8-14 hours | 3,500-4,500 hours |
Narrow-body aircraft operating domestic routes typically fly 4-6 segments daily. A Boeing 737 or Airbus A320 on a West Coast-based schedule might operate: San Francisco-Seattle (morning), Seattle-Los Angeles (midday), Los Angeles-Phoenix (afternoon), Phoenix-San Francisco (evening), San Francisco-Las Vegas (late evening), Las Vegas-San Francisco (night). That’s 6 segments from a single aircraft.
Wide-body aircraft operating long-haul international routes typically complete 1-2 segments daily due to longer flight times. A Boeing 787 on a Newark-London route departs at 6:00 PM, arrives at 6:00 AM (local), turns around, and returns to Newark by 12:00 PM (local), completing 2 segments but consuming nearly 24 hours elapsed time. Some ultra-long-haul routes (Singapore-New York, 18+ hours) allow only 1 segment per day per aircraft.
Regional jets average 5-7 segments daily operating spoke routes from hub airports. A CRJ-700 based in Chicago might fly: Chicago-Columbus (morning), Columbus-Chicago (late morning), Chicago-Indianapolis (midday), Indianapolis-Chicago (afternoon), Chicago-Milwaukee (evening), Milwaukee-Chicago (late evening), Chicago-Grand Rapids (night). That’s 7 segments serving six city pairs.
Source: FAA, Airlines for America, FlightAware
Number of Passengers in a Domestic Flight
The average domestic flight in the United States carries approximately 126-132 passengers as of 2024-2025 data, though this varies significantly by aircraft type, route, and carrier.
Average Passengers by Aircraft Type
| Aircraft Type | Seating Capacity | Typical Configuration | Average Load Factor | Average Passengers |
| Regional Jets (CRJ, E-Jets) | 50-76 | 50-76 | 75-80% | 40-60 |
| Narrow-body (737, A320) | 150-180 | 160-172 | 84-86% | 134-148 |
| Large Narrow-body (737 MAX 9, A321) | 180-220 | 190-200 | 85-88% | 162-176 |
| Wide-body Domestic (767, 787) | 220-280 | 230-260 | 82-85% | 189-221 |
Regional jets average 40-60 passengers per flight, operating thinner spoke routes from hub airports to smaller cities. A 70-seat CRJ-700 with 78% load factor carries approximately 55 passengersthese flights connect cities like Columbus, Buffalo, and Richmond to major hubs.
Standard narrow-body aircraft (Boeing 737-800, Airbus A320) carry 134-148 passengers on average, configured with 160-172 total seats and operating at 84-86% load factors. These aircraft dominate domestic operations, accounting for approximately 65-70% of all domestic flights.
Large narrow-body aircraft (Boeing 737 MAX 9, 737-900, Airbus A321) carry 162-176 passengers with 190-200 seats and 85-88% load factors. Airlines increasingly deploy these aircraft on high-demand routes, particularly transcontinental markets where wide-body aircraft would offer excess capacity.
Wide-body domestic operations average 189-221 passengers, primarily on transcontinental routes (New York-Los Angeles, New York-San Francisco, etc.) where premium cabin demand justifies larger aircraft with lie-flat business class configurations.