31 Eye-Opening Amazon Statistics 2026 (Global and U.S. Data)
From its humble beginnings as an online bookstore to its current status as the biggest online retailer in the world, Amazon has reshaped the way people shop and conduct business.
Amazon has 326 million customers and around 2 million sellers on the platform. It probably ships 1.6 million packages per day! Currently valued at $2.58 trillion (2025), the company is predicted to reach $2.62 trillion in valuation.
Discover the latest Amazon marketplace statistics in this post, covering subscribers, sales events, and growth trends. Let's take a look at the most updated statistics on Amazon here.
Amazon Statistics (Top Picks)
- Amazon has 326 million active shoppers globally.
- There are over 230 million Amazon Prime members globally, with 180.1 million in the United States alone.
- 2 million sellers actively sell on Amazon.
- Amazon made $638 billion in net sales in 2024.
- Over 353 million products are listed on Amazon.
- Small and medium-sized businesses sell more than 7,800 items on Amazon every minute.
- Amazon ships 1.6 million packages every day.
Amazon Overview
Amazon LaunchJuly 5, 1994
| Feature | Details |
| Headquarters | Seattle, Washington, United States |
| Origin | Started as an online marketplace for books called "The Everything Store. |
| Initial features | Vast selection of books, customer reviews, personalized recommendations, and web transactions. |
| Stock price | $241-245 |
| Valuation | $2.58 trillion (2025) |
| Amazon Prime Subscribers | 250 million |
| Active Sellers | 2 million |
| Employees | 1,556,000 |
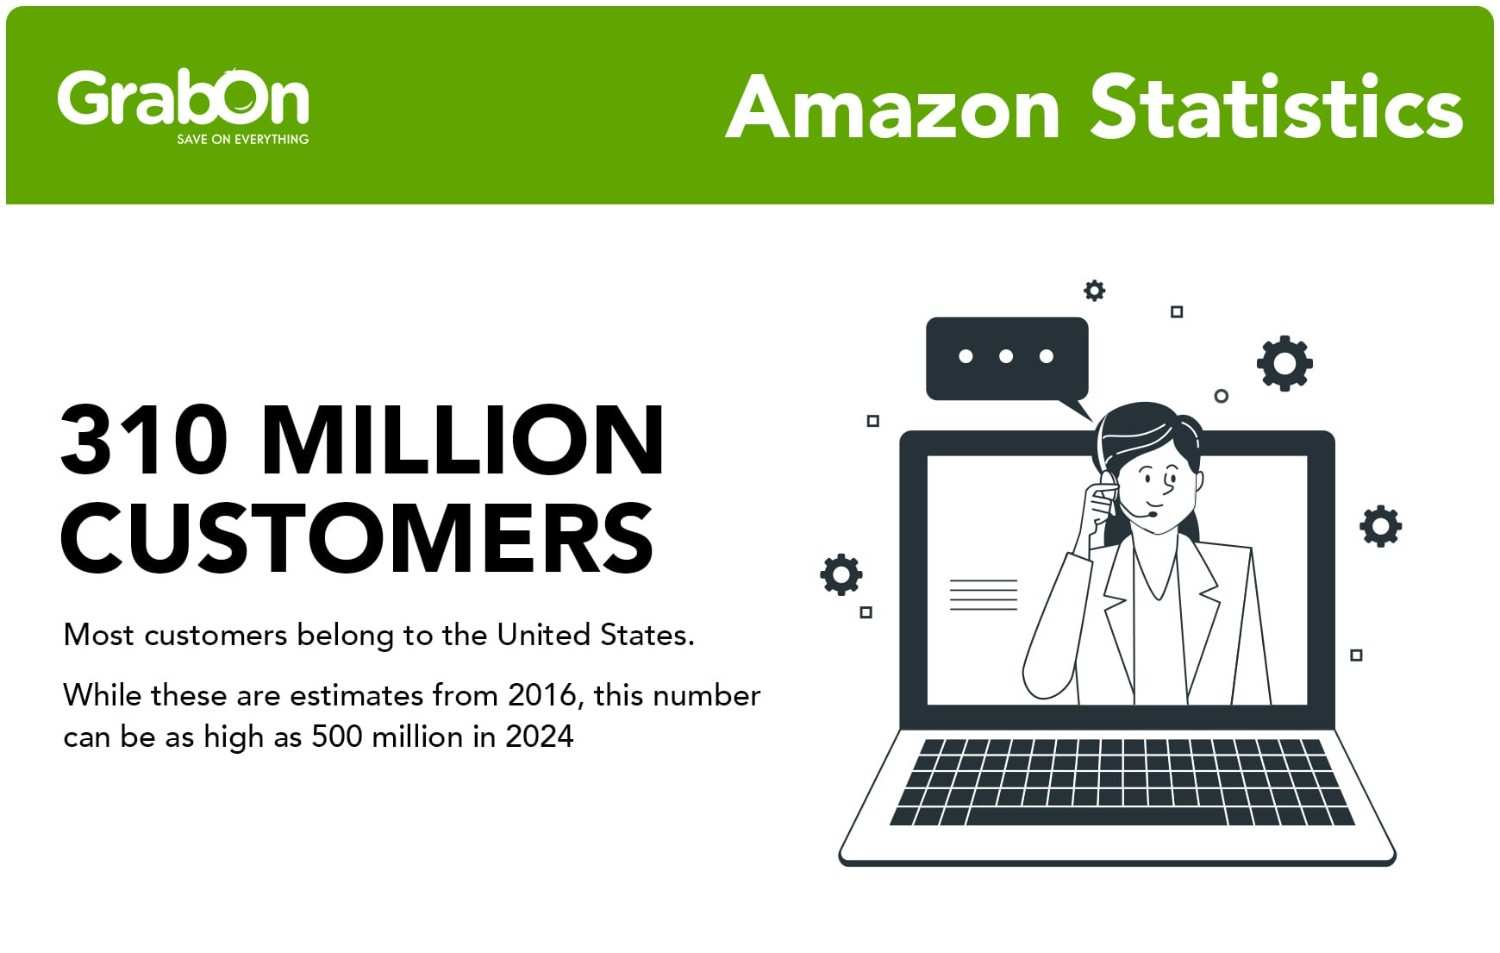
Number of Global Amazon Shoppers
Amazon has 326 million active shoppers globally, which means 11.7% of the global online shoppers purchase on the e-commerce platform. Amazon active shoppers are users who have made at least one purchase on the platform in the past 12 months.
The United States is the platform's largest market in terms of users and revenue.
Here is a table showing the user traffic to Amazon.com from different countries:
| Country | Traffic Share |
| United States | 87.21% |
| India | 0.91% |
| Colombia | 0.78% |
| China | 0.76% |
| Canada | 0.72% |
Source: Statista, Similarweb.
Amazon Prime Member Statistics
Amazon Prime was launched 19 years ago, offering free two-day shipping on over 1 million products. Although the service took off slowly in the initial years, the consistent improvement and addition of perks to subscribers have made it one of the most successful subscription services today.
The number of Amazon Prime members in 2025
There are over 250 million Prime members worldwide, the majority of which are from the United States.
Amazon stopped reporting the number of Prime users after 2020. Some third-party research firms estimate that the number of Amazon Prime members is well over 247 million.
Here is a table showing the number of Amazon Prime members over the years:
| Year | The Number Of Amazon Prime Users |
| 2016 | 46 million |
| 2017 | 66 million |
| 2018 | 100 million |
| 2019 | 120 million |
| 2020 | 150 million |
| 2021 | 200 million |
| 2022 | 213 million |
| 2023 | 230 million |
| 2024 | 250 million |
Sources: Amazon, Business Of Apps.
Amazon Prime Subscribers in the United States
The United States has 180.1 million Amazon Prime members as of 2024. That is equivalent to 50% of the country’s population and 78.3% of the total Amazon Prime members.
Amazon Prime members have grown by 23.27% since 2020, and is one of the most successful subscription services in the world.
Here is a table showing the number of Amazon Prime subscribers in the United States:
| Year | Number of users |
| 2013 | 25 million |
| 2014 | 40 million |
| 2015 | 54 million |
| 2016 | 65 million |
| 2017 | 99.7 million |
| 2018 | 112.1 million |
| 2019 | 124 million |
| 2020 | 146.1 million |
| 2021 | 161.7 million |
| 2022 | 168.3 million |
| 2023 | 173 million |
| 2024 | 180.1 million |
| 2025 | 190 million (est.) |
Sources: CIRP Amazon Report, Statista.
Amazon Prime members spend $800 more than non-Prime members
An average Prime member spends around $1,400 on Amazon every year while non-Prime members spend $600.
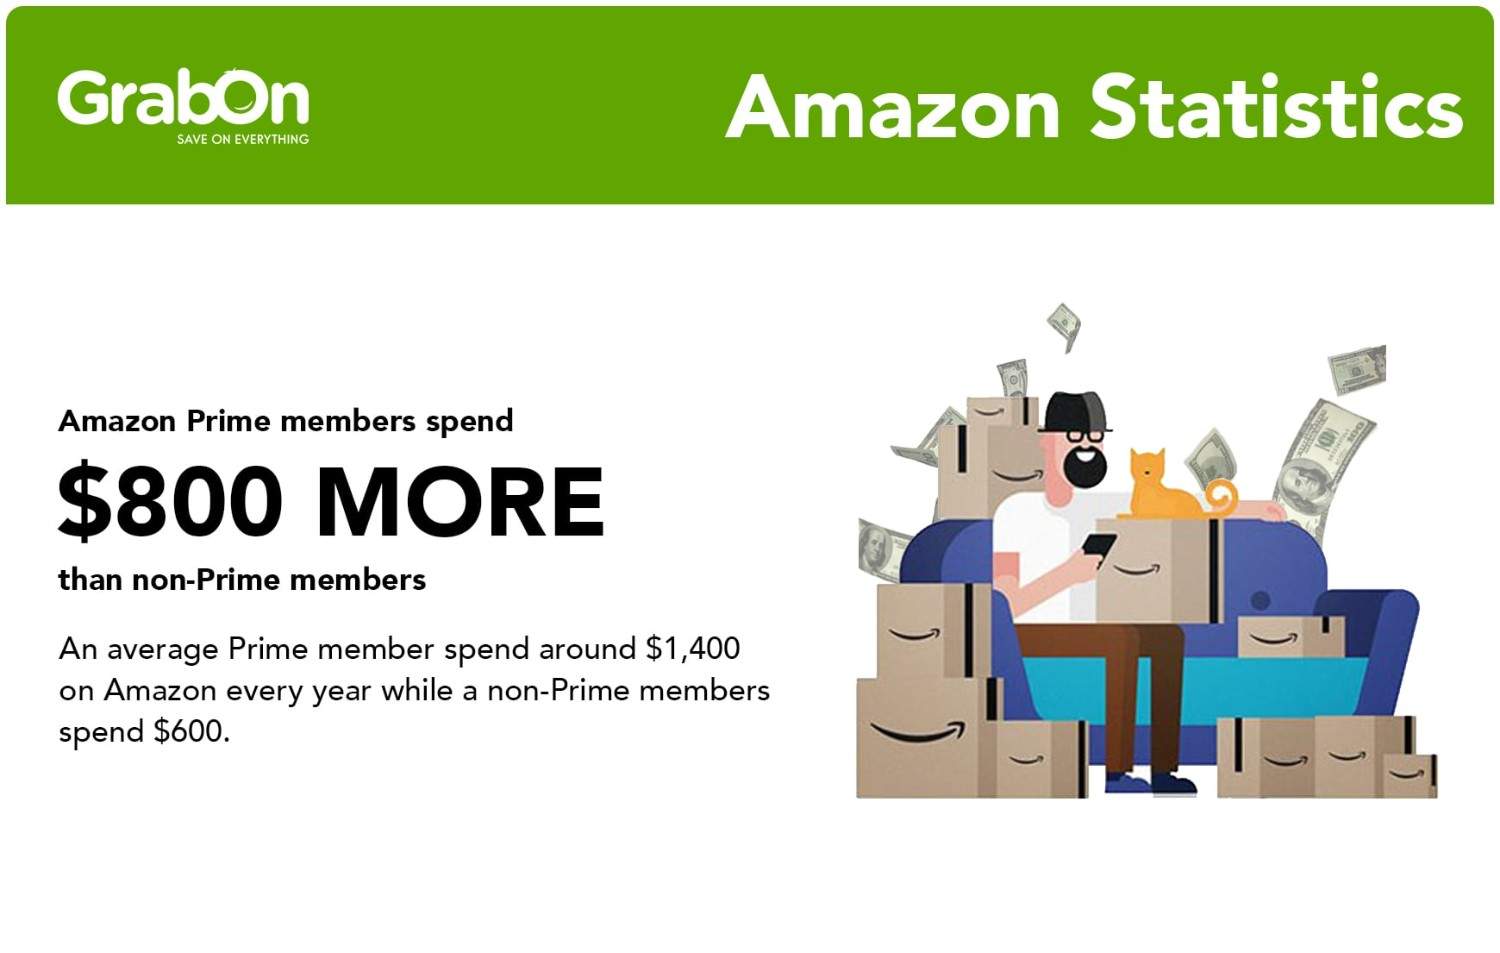
That is 133% more spending on Prime eligible products! If you are a seller and reading this stat, you now understand the importance of achieving Prime-eligible status.
Source: Statista.
Amazon Prime Days Statistics
Prime Day is Amazon’s yearly sale exclusive for Prime members which has been taking place in July of every year since 2015. The sales get bigger every year and is famous for breaking its own record for the number of sales and engagements. Shoppers often maximize their savings by utilizing Amazon Coupon Codes during these events.
Amazon Prime Day 2025 was the biggest sales event in Amazon's history
While Amazon did not disclose the exact numbers, More than 300 million items were available with free Prime shipping, and tens of millions of the most popular products were available with free Same-Day or One-Day Delivery during the Amazon Prime Day event.
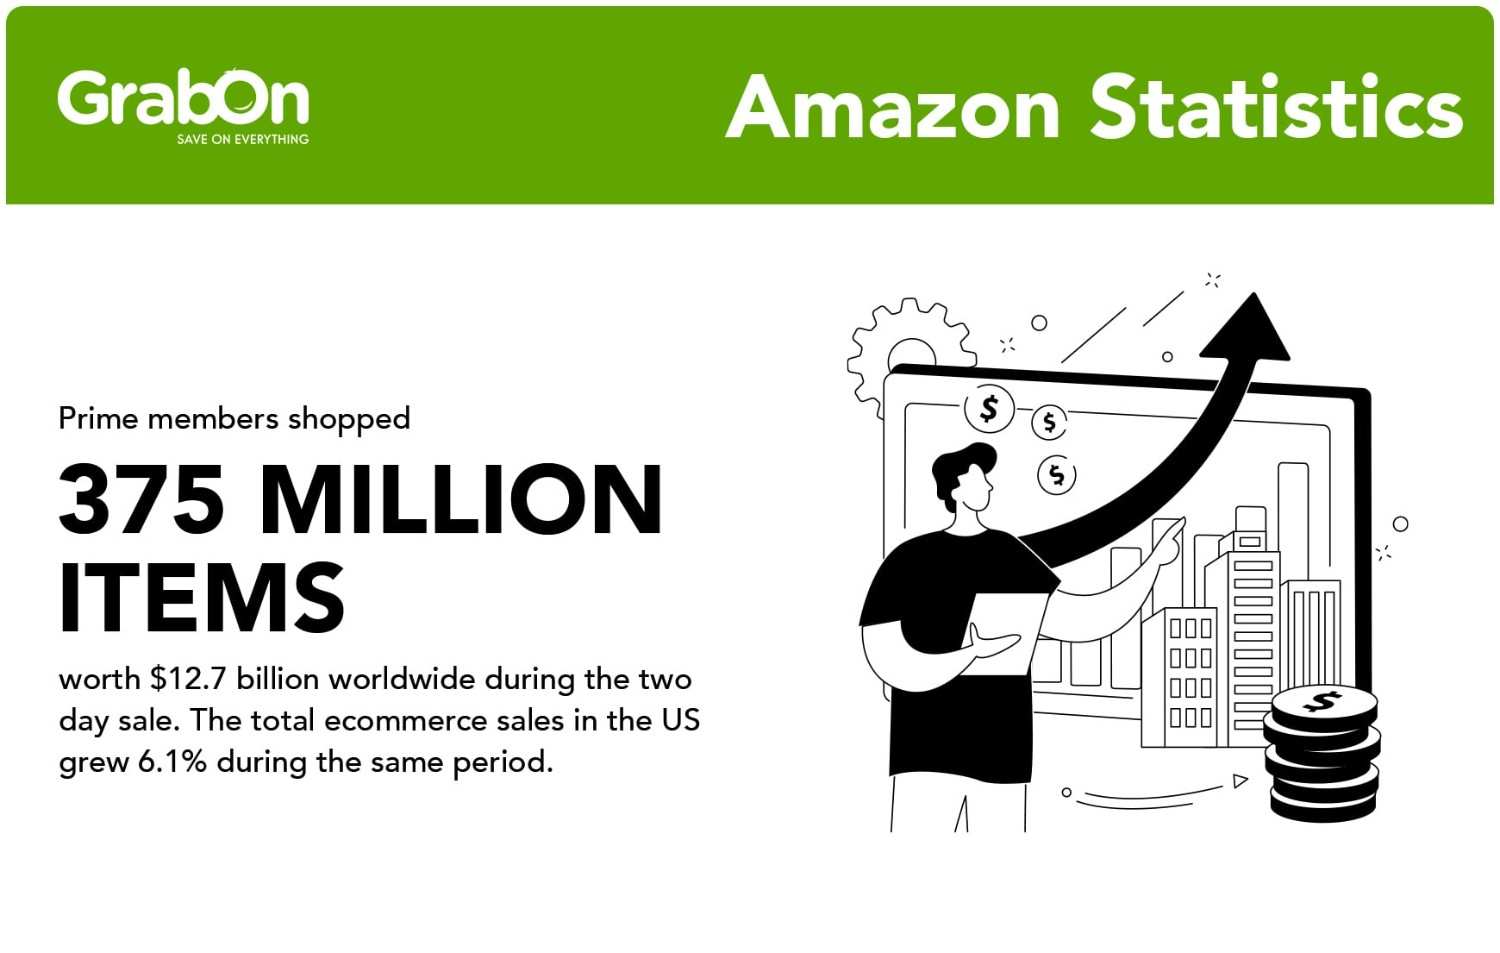
But in the previous year, Amazon Prime members shopped 375 million items worth $14.2 billion worldwide during the Amazon Prime Day 2024 sale. The total e-commerce sales in the US grew 6.1% during the same period.
During Amazon Prime Day 2025, peak average discounts ranged from 11% to 24% across top categories like apparel, electronics, toys, and televisions. Amazon expanded the event from two days to four, boosting revenue for brands and driving higher engagement. Demand surged 165% year-over-year in the final two days, making it the retail bonanza’s strongest finish yet.
Prime Day 2025 was also the biggest Prime Day event ever for independent sellers, whose sales growth in Amazon's store outpaced Amazon’s retail business
Source: Amazon, Barrons, Amazon Prime Day 2025.
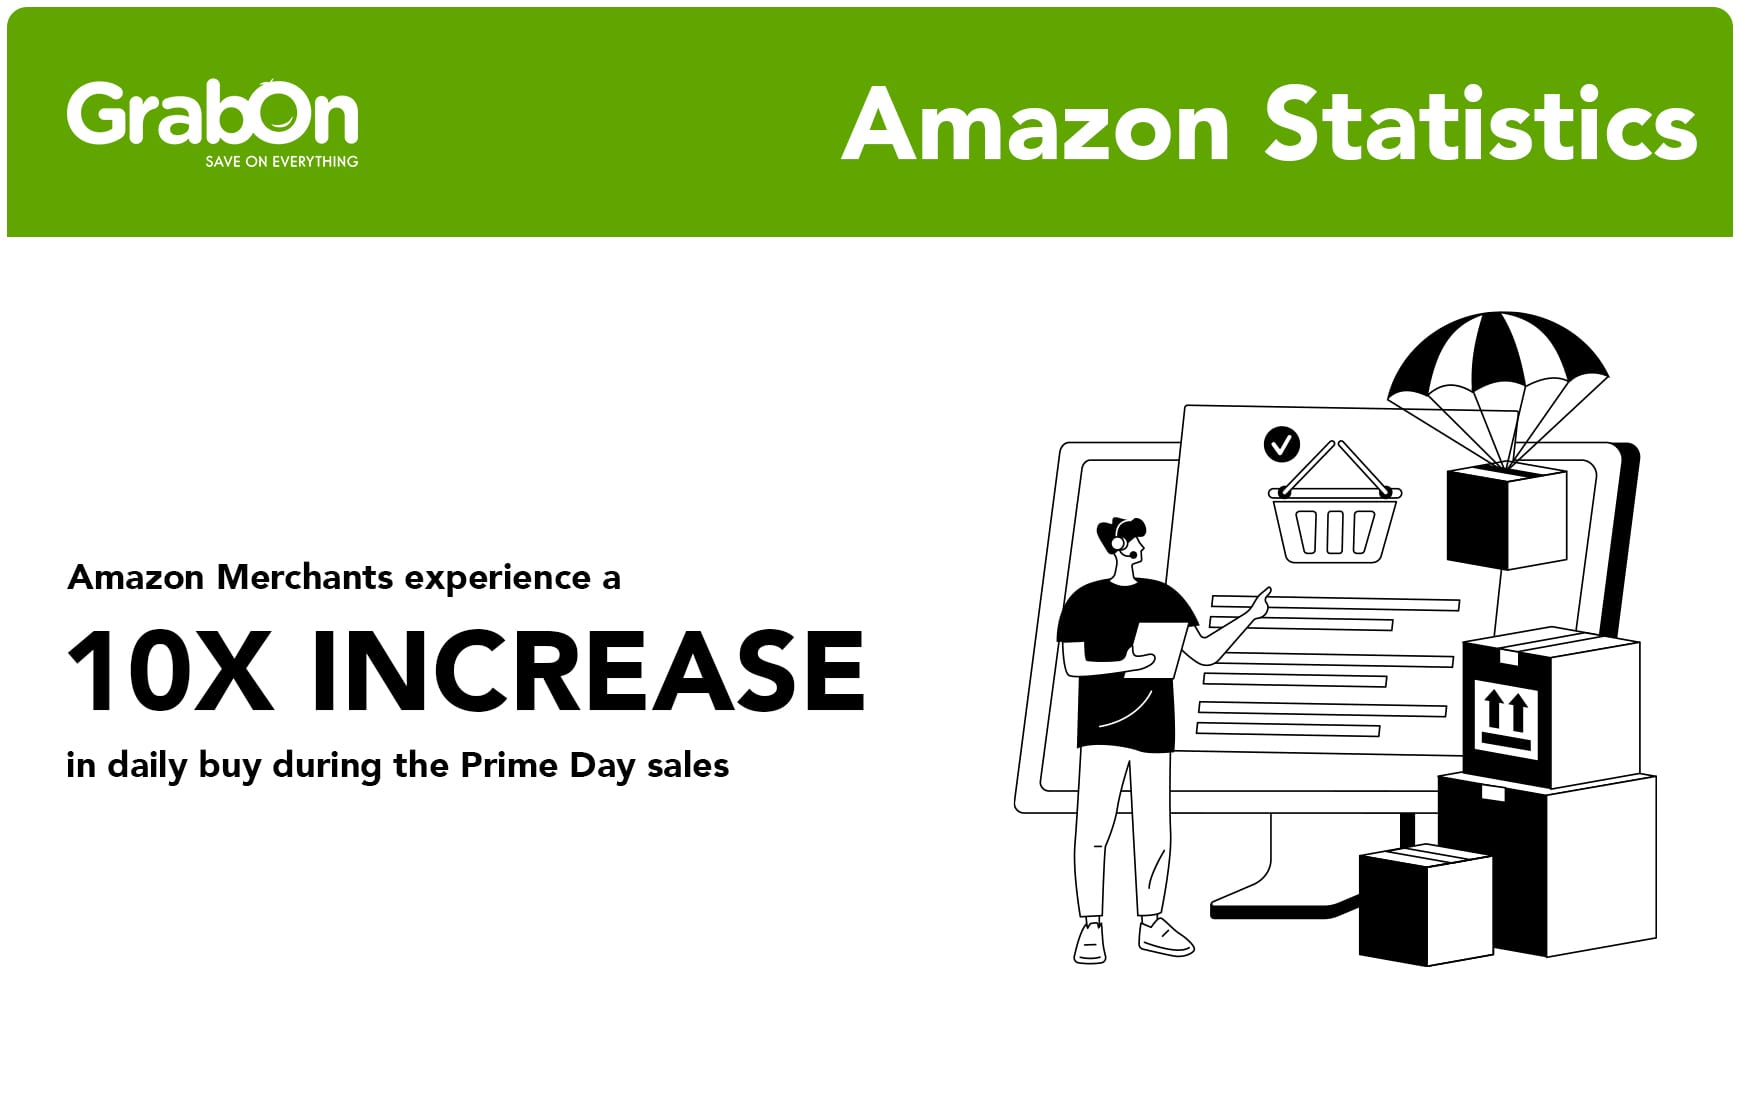
Amazon Merchants experience a 10x increase in daily buys during the Prime Day sales.
Merchants who participated in Prime Day had 10 times more Buy with Prime orders daily and their revenue from these orders increased eightfold compared to the month before Prime Day was announced.
Source: Amazon
Prime Day brings in huge sales for SMBs
Prime Day 2024 was the largest ever for independent sellers. SMBs received 20 orders every second during the 2024 Prime Day event.
Additionally, over 90,000 SMB sellers received orders from Prime members across 19,000+ zip codes.
Over 15,000 SMBs saw their best-ever sales during Prime Day 2023.
Source: Amazon.
6 out of 10 shoppers research products before buying them on Prime Day
Statistisc reveal that 61% of Shoppers like to dig more about their products before they actually buy them on Prime Day.
This involves reading user-generated reviews across platforms and consulting their friends and family. Many would also check the price history of the products and set a tracker to compare the prices.
Amazon Customer Behavior Statistics
Know the customer behavior trends and other interesting insights in this section.
67% of Amazon shoppers prefer desktop for checkout
Despite the growing mobile-first trend, Amazon shoppers still favor desktops over mobile for purchases, with 67% preferring desktops and only 24% opting for mobile devices.
shoppers tend to browse on mobile but buy on desktops. This underscores the ongoing importance of mobile in Amazon’s buyer journey. Investments in AR and faster purchase options signal a future focused on enhancing online shopping convenience.
Sources: CPCStrategy, Amazon Pay.
Better reviews lead to better conversions on Amazon
For every increase in star rating by 1, there is about a 4-5% increase in conversion rate. Conversion rate goes up by 12% with an Amazon star rating increase from 3 to 5.
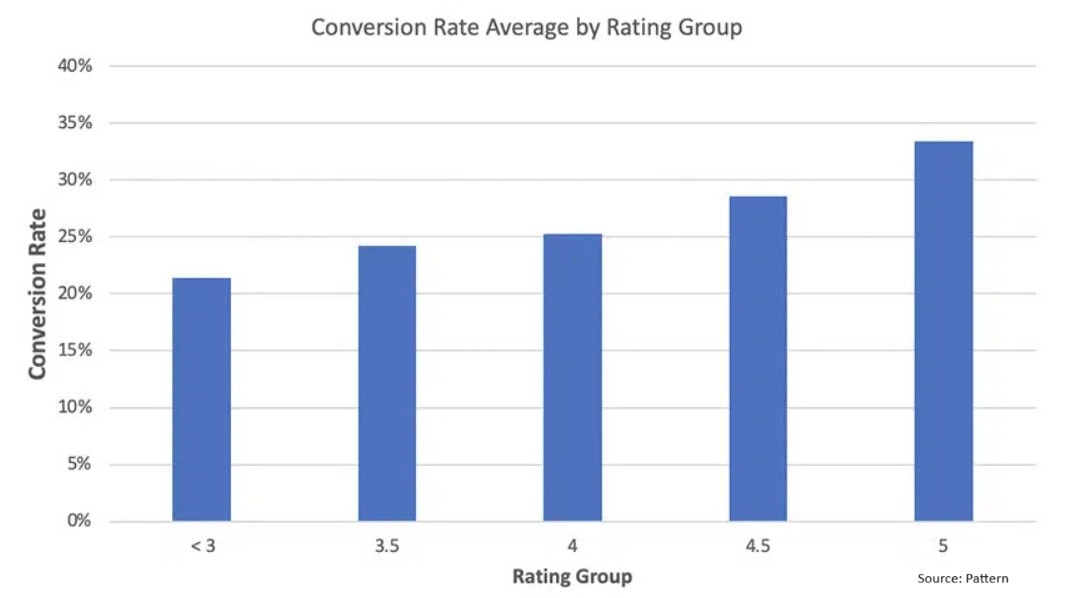
The importance of reviews is further highlighted by the fact that 64% of Amazon shoppers said they got influenced by products with best ratings and reviews.
Source: Pattern, Jungle Scout
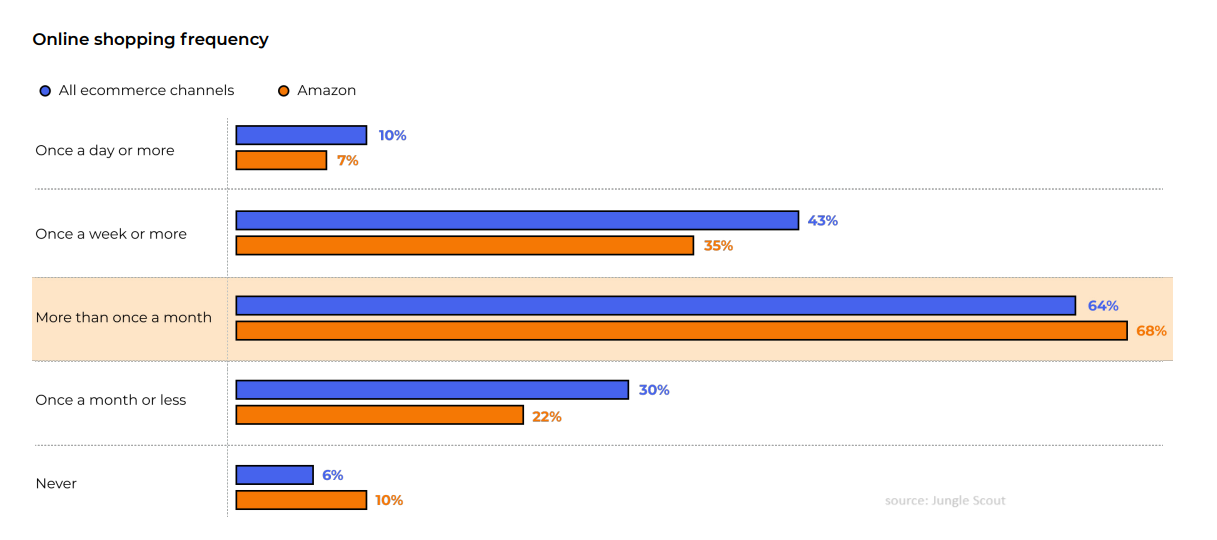
35% of Amazon shoppers purchase something at least once a week
A Jungle Scout report from Q1 2024 35% of Amazon shoppers purchase something at least once a week, and as many as 10% say they do so every day.
The report also revealed that 68% of shoppers shop on Amazon every month while 10% do not shop at all.
Factors that influence purchase decisions on Amazon
The price point has the greatest influence on which products consumers choose to buy as 64% of shoppers said they strongly agree with the fact that they look for the product with the lowest price while shopping on Amazon
58% of shoppers said they look for products with prime or fastest shipping when they shop on Amazon.
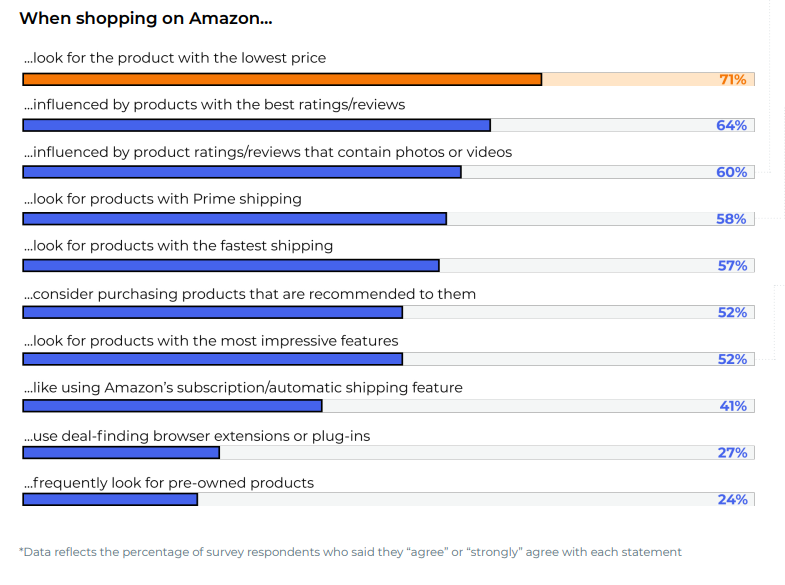
Source: Jungle Scout
Amazon Seller Statistics
With over 2 million active sellers and 3,700 new ones joining daily, the platform continues to evolve rapidly a trend clearly reflected in recent Amazon seller statistics that highlight this growing competition.
However, the majority of these sellers fail to make data-backed decisions and end up quitting. Done be among them! learn from these insights and stand out from the crowd.
There are 2 million active Amazon sellers
There are currently 2 million active sellers on Amazon. With 3,700 new sellers joining the platform every day, Amazon will have 1.35 million new sellers by the end of the year.
Over 9.7 million sellers have joined the Amazon marketplace to date.
61% of Amazon's sellers are third-party sellers.
40% of Amazon sellers make $1,000 to $25,000 every month
4 out of 10 Amazon sellers make $1,000 to $25,000 every month, that translates to $12,000 to $300,000 in annual sales.
Amazon can bring in more money than the average side hustle for solo sellers and small businesses. Stats reveal that 19% of SMB sellers surpass $10,000 in average monthly sales on the platform.
It’s also a profitable channel for enterprise brands and retailers, with 78% generating over $50,000 in average monthly sales.
Well, only 1% of sellers are able to make a million dollars on Amazon in a month!
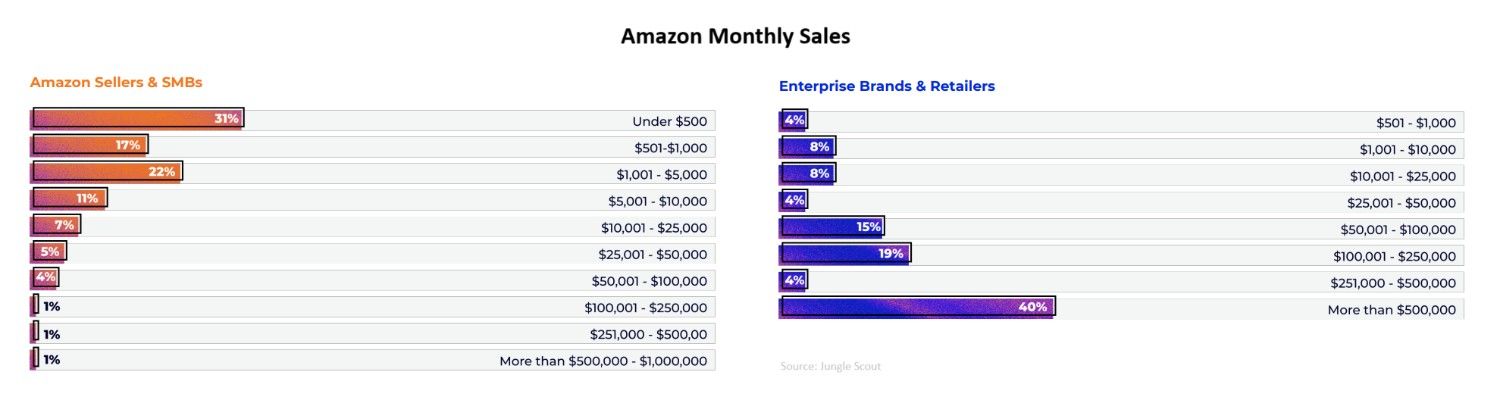
Source: Jungle Scout
60% of Amazon sellers also sell their products on other platforms
More sellers are embracing omnichannel commerce. 60% of Amazon sellers were selling their products on at least one other platform besides Amazon (mainly eBay).
The introduction of TikTok Shop last year has made people more excited about selling stuff on social media, 20% of Amazon sellers and SMBs plan to expand to TikTok Shopping in 2024.
A notable 36% of sellers also plan to set up their own online store using Shopify and sell besides Amazon.
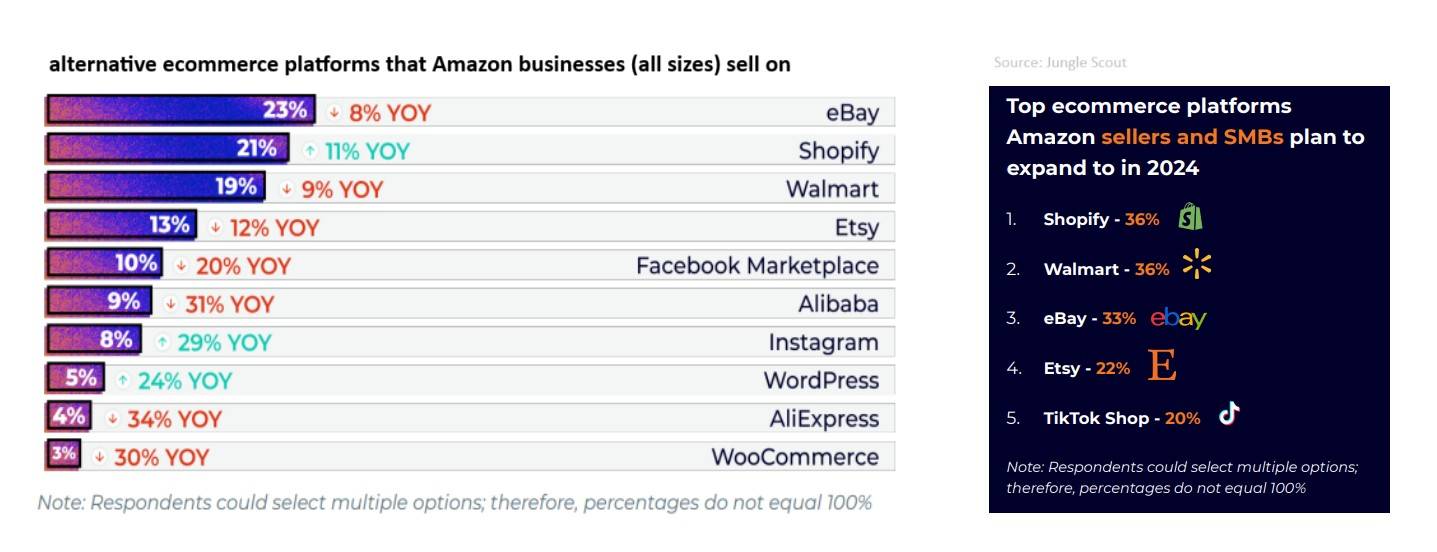
Source: Jungle Scout.
Over 50% of Amazon sellers are white label sellers
54% of sellers on Amazon follow the Private label model while 25% are wholesalers.
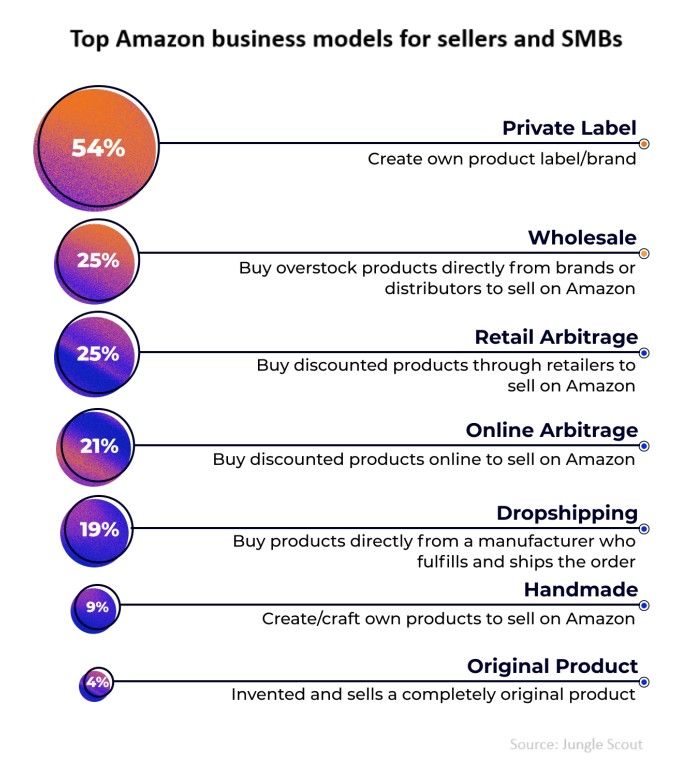
19% of Amazon sellers are dropshippers. 50% of dropshippers on Amazon spend less than $2,500 to start selling on the platform, with 17% spending $500 or less.
39% of dropshippers earn $5,000 or less dropshipping products on Amazon with 48% seeing profit margins between 11-25%
Here is a table showing the profitability range and sales range of different business models on Amazon:
| Amazon Business Model | Average Profitability Range | Average Monthly Sales | Average Time to Profitability | Average Startup Cost |
| Private Label | $5,000 or more | $5,000 | Within 6 months | $2,500 or more |
| Retail Arbitrage | Less than $5,000 | Less than $5,000 | Up to 6 months | Less than $1,000 |
| Online Arbitrage | Less than $5,000 | Less than $5,000 | Within 6 weeks | Less than $2,500 |
| Wholesaling | $5,000 or more | $5,000 | Within 6 weeks | Less than $2,500 |
| Dropshipping | Less than $5,000 | $5,000 or less | Longer than 6 weeks | Less than $2,500 |
| Handmade | Less than $5,000 | Less than $5,000 | 3 months to 1 year | Less than $2,500 |
Source: Jungle Scout
Getting reviews is one of the most common problems faced by Amazon sellers
A mere 1-2% of satisfied customers leave reviews, and sellers (especially new ones) find it difficult to build trust with potential customers who rely heavily on reviews for buying decisions. Amazon's restrictions on incentivized reviews further complicate matters, eliminating a potential tactic for boosting review volume and forcing sellers to rely on slow organic acquisition strategies.
82% of adults actively seek them out before making a purchase online, a single star increase in rating can lead to a 26% sales jump, and listings with reviews convert 3.5x higher.
Sources: eComEngine, Search Engine Journal.
Amazon SMBs Statistics
This section highlights some interesting insights about the 2 million small business that sell on Amazon globally.
There are 2 million Small sizes businesses on Amazon
And they are responsible for 60% of Amazon's total sales. By leveraging Amazon’s reach and services, SMBs can compete on a wider scale and reach new markets.

Although the competition is cutthroat, the customer pool is a massive 300 million strong. With sales reaching sky-high during prime days.
Source: Amazon
Small and medium US businesses sell more than 7,800 items on Amazon every minute
Independent sellers on Amazon sell more than 4.1 billion products in a year, which averages at 7,800 products every minute.
These sales are responsible for over $230,000 in sales in Amazon’s stores.
The number of sales for SMBs peaks during the Amazon Prime days and is quite high during the Prime Big Deal Days.
Source: Amazon.
Health and personal care is the #1 selling category for SMBs
Beauty and home related products sell the second and third most on the eCommerce platform. Groceries and Apparels round up to the top 5!
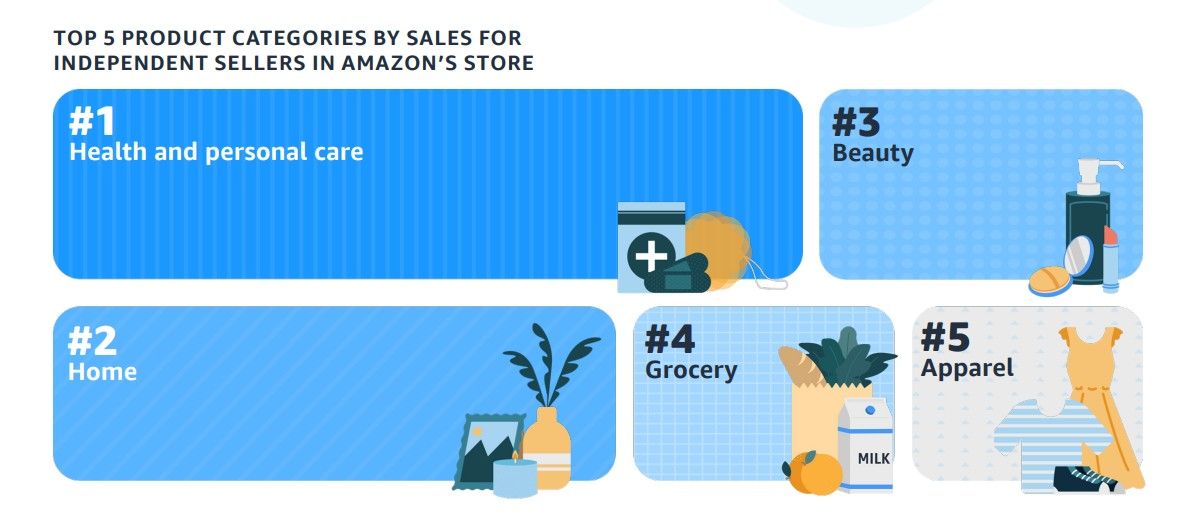
Source: Amazon.
Additional Tip: Amazon Seller University has thousands of hours of free educational content for sellers at all stages of their journey
Amazon SMBs in the United States at a glance
- California is the state with the most independent sellers while Alaska is the fastest-growing
- Amazon independent sellers created 1.5 million U.S.-based jobs directly tied to operating their businesses in 2k22.
- Wyoming has the largest growth percentage of independent sellers.
Read the complete report here.
Amazon FBA Statistics
'Fulfillment by Amazon' let sellers outsource storage, picking, packing, shipping, and even customer service for their products to Amazon’s vast fulfillment network. This strategic move Freed sellers from the burden of logistics and allowed them to focus on product sourcing, marketing, and brand building eventually increasing customer satisfaction.
82% of Amazon Sellers use FBA Program
7.9 million Amazon sellers use FBA to sell. An average seller sees over 2000% increase in sales after adopting FBA.
There is one more method to sell on Amazon known as "FBM – Fulfillne By Merchant. 34% of sellers on the platform choose to go with this method. However, the usage of FBM decreased by 9% YoY.
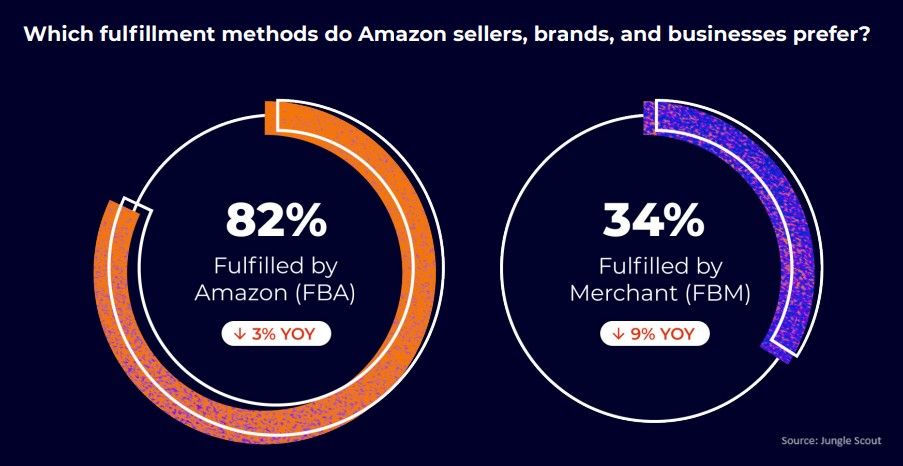
Sources: Jungle Scout, Amazon.
Sellers save 30% in shipping costs by using FBA
Shipping with FBA costs 30% less per unit than standard shipping options offered by major US carriers and 70% less per unit than premium options comparable to FBA.
Source: Amazon
Amazon Financial Statistics
This section sheds a light on where Amazon as a whole stands in terms of Financials.
Amazon Revenue Over The Years
Amazon reported a revenue of $638 billion in 2024, which is an increase of 10.99% from the previous year.
North America is the biggest contributor to Amazon’s net sales, contributing to 70% of the revenue.
Here is a table showing Amazon’s Net sales revenue over the years:
| Year | Amazon's Net Sales Revenue |
| 2004 | $6.92 billion |
| 2005 | $8.49 billion |
| 2006 | $10.71 billion |
| 2007 | $14.84 billion |
| 2008 | $19.17 billion |
| 2009 | $24.51 billion |
| 2010 | $34.2 billion |
| 2011 | $48.08 billion |
| 2012 | $61.09 billion |
| 2013 | $74.45 billion |
| 2014 | $88.99 billion |
| 2015 | $107.01 billion |
| 2016 | $135.99 billion |
| 2017 | $177.87 billion |
| 2018 | $232.89 billion |
| 2019 | $280.52 billion |
| 2020 | $386.06 billion |
| 2021 | $469.82 billion |
| 2022 | $513.98 billion |
| 2023 | $574.78 billion |
| 2024 | $638 billion |
| 2025 (Sept) | $691 billion |
Source: Macrotrends
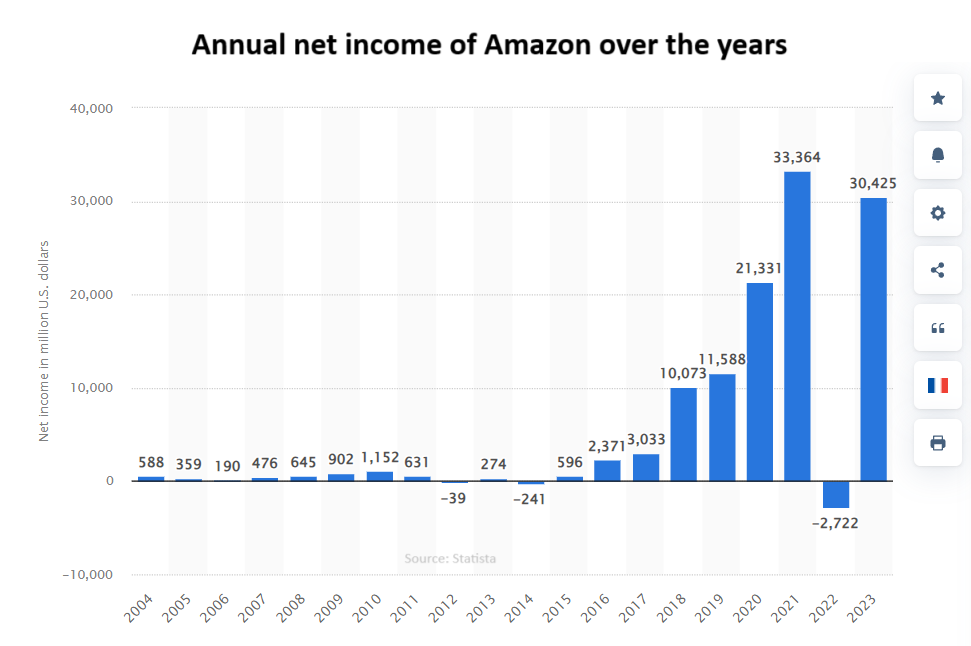
Amazon Net Income
Amazon reported it registered a net income of $59.2 billion in 2024, an increase of 64.2% from the previous year. As of the quarter ending for September 2025, Amazon's Net Income was $21.18 billion (a 38.22% YoY increase)
Amazon’s total Net income in 2023 was a whopping $30.42 billion. That's a good bounce back after recording a net income of -2.72 billion USD in 2022. Amazon has recorded net income in the negatives only thrice since 2004.
Here is an infographic showing Amazon's net income over the years:
Sources: Amazon Investor Letters, Seeking Alpha, Publishers Weekly.
Amazon Market Share
Amazon is the biggest retailer in the United States and globally too! While owning over 35% of the market share in the US, Amazon also has the highest net sales worldwide.
If that wasn't enough, it also tops the chart as the most visited Ecommerce platform globally!
Amazon's dominance in e-commerce continues to shape global online shopping, but it also competes with several major retail and marketplace platforms across different segments.
Traditional retailers like Macy's and Kohl's are widely used by shoppers looking for extra savings across fashion and home essentials.
At the same time, global marketplaces such as AliExpress and eBay offers attract bargain hunters with competitive pricing and wide product variety.
Meanwhile, Shein remains popular among fashion-focused users looking for trendy, budget-friendly styles.
Amazon owns 37.6% of the United States retail market
This makes it the biggest retailer in the country by an huge margin, Walmart, which is on the second spot holds a market share of 6.4%.
This huge gap between the market share is pretty much self explanatory that Amazon will be on the top for times to come.
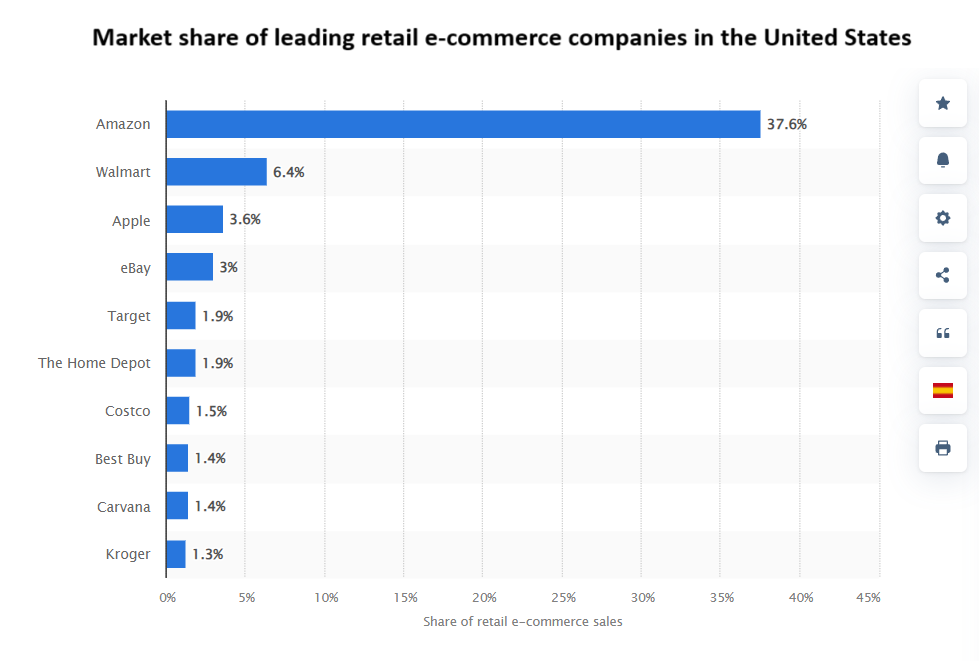
Source: Statista.
Amazon is the fourth fastest-growing eCommerce company in the US
Amazon may be the biggest retailer but it loses a few spots when it comes to the growth rate. Carvana leads the way with a growth rate of 22.7%.
Chewy, the pet food retailer sits in the second spot with an 9.2% growth rate while Walmart ends up in the third spot with a 11.3% growth rate.
Finally, we have Amazon with a growth rate of 11.7%.
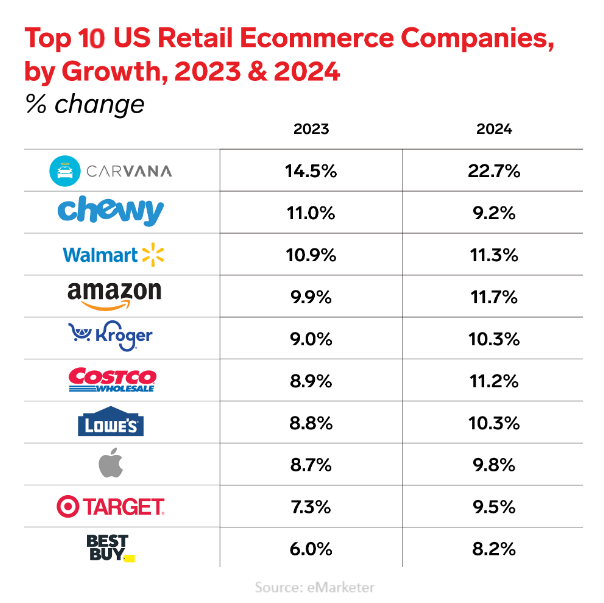
Source: eMarketer.
Amazon’s Market Cap makes it the 5th most valuable company
Amazon’s market cap is at its all-time high as of December 2024 sitting at $2.32 trillion making it the 4th most valuable company at the time.
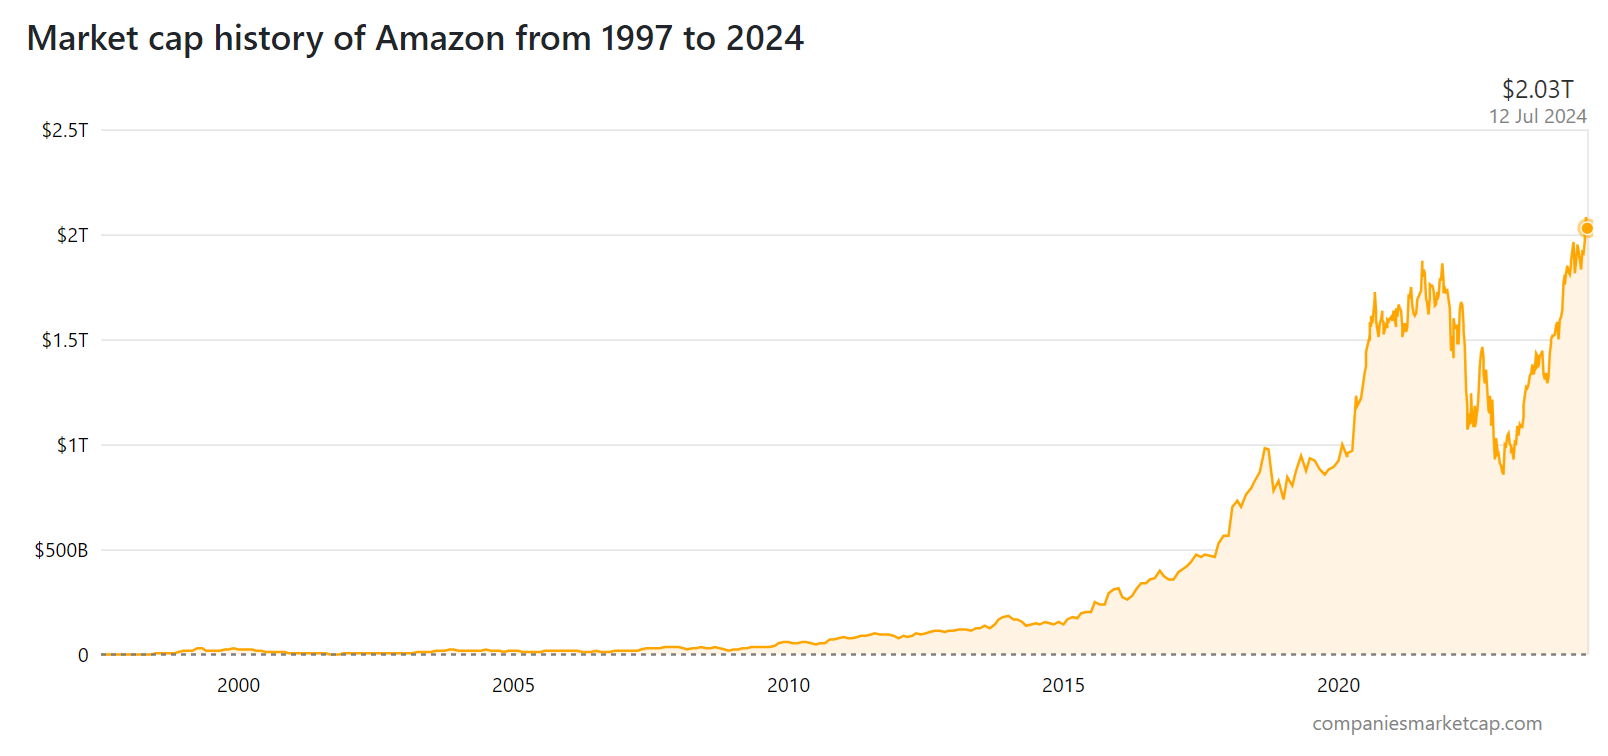
Source: Companies Market Cap.
General Amazon Statistics and Facts
Here are some interesting facts about Amazon that truly justify the grand status of Amazon.
Amazon sells more than 353 million products
Amazon along with its third-party sellers has an inventory of 353 million products. Amazon alone has an inventory of 12 million products.
Source: BigCommerce
Amazon sells products worth $18,242 every minute
Amazon sold products worth over $18k every minute. That means Amazon sold approximately $1.574 billion worth of products every day, and around $47.90 billion every month.
Amazon ships 1.6 million packages per day
With it's automated warehousing and trained staff, Amazon is able to ship 1.6 million packages every day across the globe. That’s over 66,000 packages per hour, and over 1,000 per minute.
Source: Mobiloud
Amazon.com gets over 3 billion visits every month
Amazon.com was visited 9.85 billion times from May to July bringing the average monthly visits to 3.3 billion. These billions of visitors spend an average of 13 minutes on the platform and visit 5 pages per visit.
Source: Semrush
Number of Amazon employees
Currenly Amazon has 1,556,000 full-time and part-time employees. Amazon’s headcount peaked in 2021 when the company employed 1,608,000 full- and part-time employees.
Amazon also laid off many employees after 2021. The recent laid off being in late 2025, with 14,000 employees being laid off across various departments like AWS, HR, and tech.
Sources: Amazon
Amazon's Timeline Infographic (1994-2023)
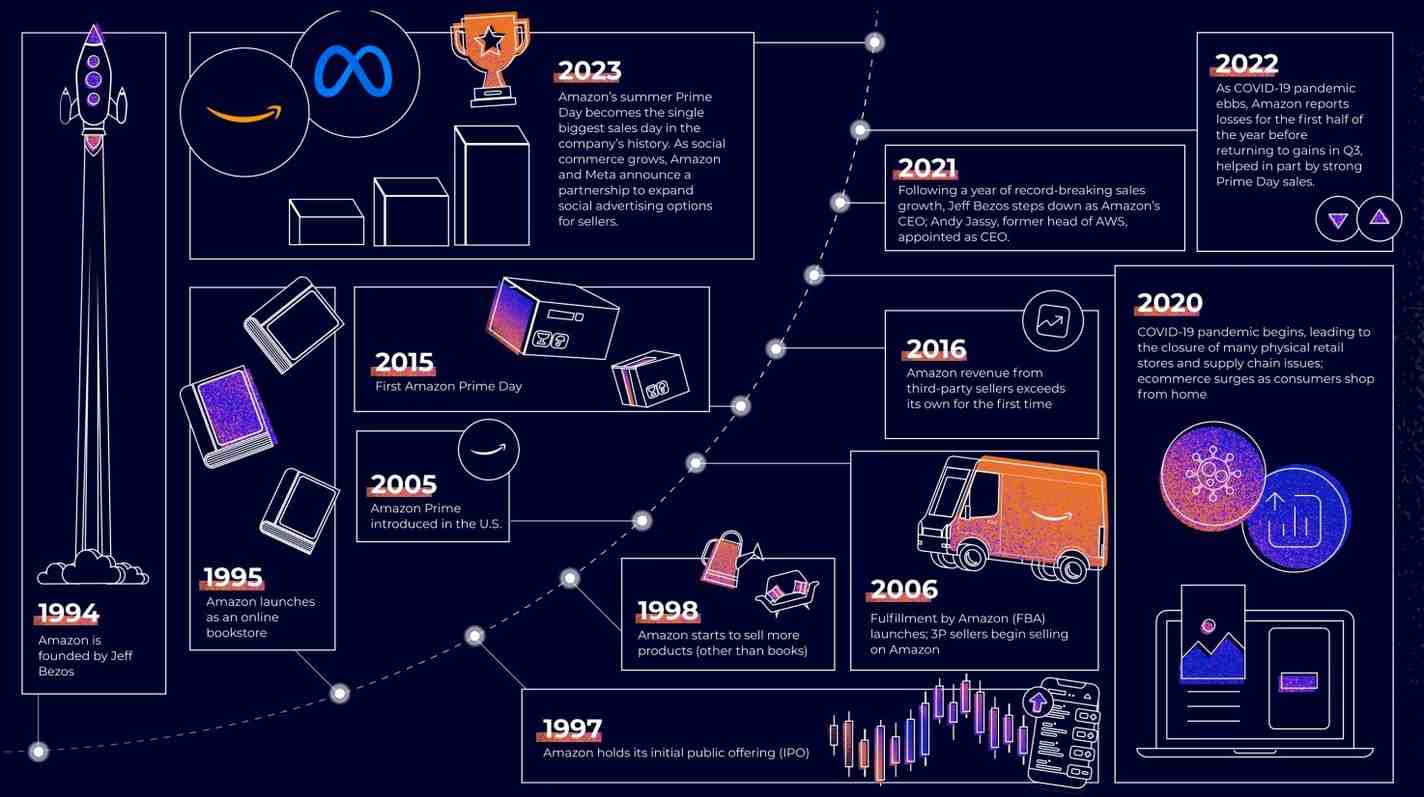
Source: Jungle Scout