Brick-and-Mortar Shopping Retail Statistics (2025 Data)

The brick-and-mortar sales worldwide were around $21.8 trillion in 2024, and a majority of sales happened in the U.S., with total in-store sales reaching $7.07 trillion. It is projected that the total offline sales worldwide will cross $22.7 trillion, and in the US, it will cross $8.27 trillion by the end of 2025.
The United States is home to 1.08 million brick-and-mortar stores with over 17,912,647 employees working there, with the count increasing gradually over the year.
In this blog, we will see some crucial brick-and-mortar shopping statistics that will help you get deeper insights into the state of the current retail industry worldwide and in the United States.
We will also check the walk-in demographics, return rates, and customers' buying behaviors of brick-and-mortar stores.
Top Brick and Mortar Shopping Statistics in 2025
- There are over 1.08 million physical stores in the United States
- Brick-and-mortar sales in the US are projected to cross $8.27 trillion by the end of 2025.
- 92% of US retailers operate at least one brick-and-mortar store
- 74% of shoppers in physical stores research store-related information online before visiting
- Brick-and-mortar stores experience an average return rate of around 16.9%
- 50% of US shoppers prefer to physically try products before making a purchase in-store
Brick-and-Mortar Retail Sales (Global)
Global brick-and-mortar sales reached $21.8 trillion in 2024 and are expected to increase by 4.13% in 2025 and reach $22.7 trillion by the end of the year.
The sales will further reach $24.5 trillion by 2027, marking a 7.93% increase between 2025 and 2027.
The table below shows the growth of brick-and-mortar sales worldwide over the years:
| Years | Global Brick and Mortar Sales |
| 2027* | $24.5 trillion* |
| 2026* | $23.6 trillion* |
| 2025* | $22.7 trillion* |
| 2024 | $21.8 trillion |
| 2023 | $20.8 trillion |
| 2022 | $20 trillion |
Brick-and-Mortar Retail Sales in the United States
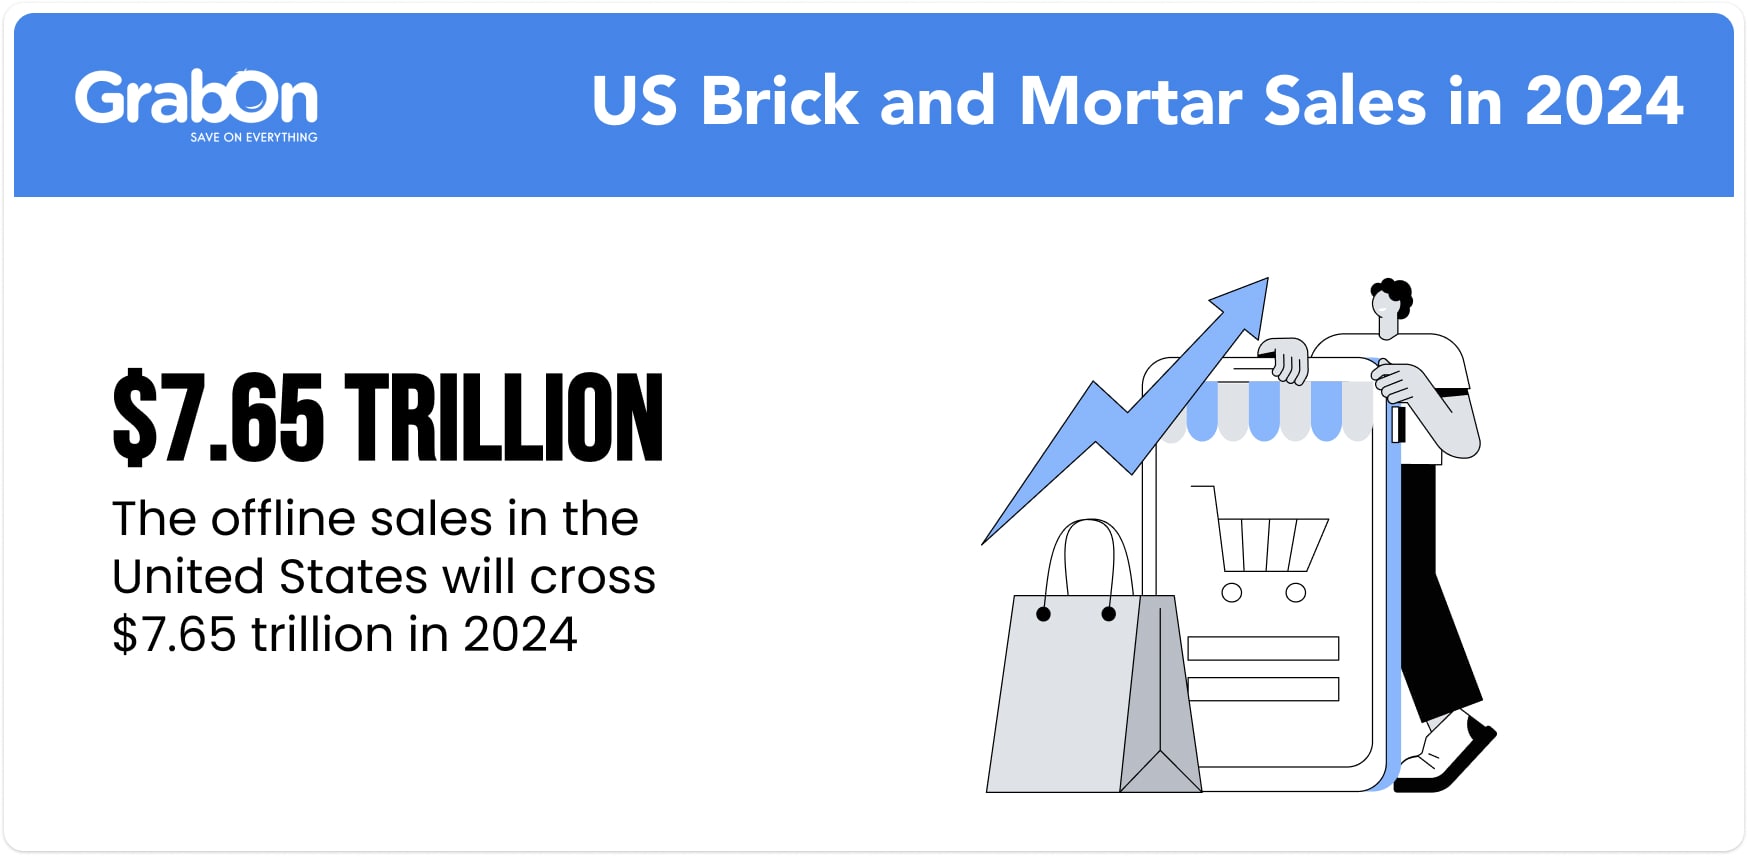
The US brick-and-mortar sales crossed $7.65 trillion in 2024 and are estimated to reach $8.27 trillion by the end of 2025, with 1st quarter sales already reaching around $1.82 trillion. The in-store sales comprise around 82.2% of the total retail sales in the country.
It is projected that the brick-and-mortar sales in the US will exceed $8.94 trillion in 2026.
Let's check the brick-and-mortar sales revenue in the US over the years:
| Years | Annual US Brick and Mortar Sales | Year-on-Year Growth |
| 2026* | $8.94 trillion* | +8.10%* |
| 2025* | $8.27 trillion* | +8.10%* |
| 2024 | $7.65 trillion | +8.20% |
| 2023 | $7.07 trillion | +2.17% |
| 2022 | $6.92 trillion | +9.15% |
| 2021 | $6.34 trillion | +18.95% |
| 2020 | $5.33 trillion | -3.27% |
| 2019 | $5.51 trillion | +2.04% |
| 2018 | $5.4 trillion | +3.65% |
| 2017 | $5.21 trillion | +3.37% |
| 2016 | $5.04 trillion | +2.23% |
| 2015 | $4.93 trillion |
Brick-and-mortar stores in the US generated a daily revenue of around $20.96 billion as of 2025. This is a 10.91% YoY increase.
9 out of 10 retailers in the United States have at least one brick-and-mortar store in their location. Another 71% of in-store retailers plan to hire more employees to handle sales and returns during the holiday season.
Source: Statista 1, Statista 2, US Census Bureau, NRF.
How many Brick and Mortar stores are in the US?
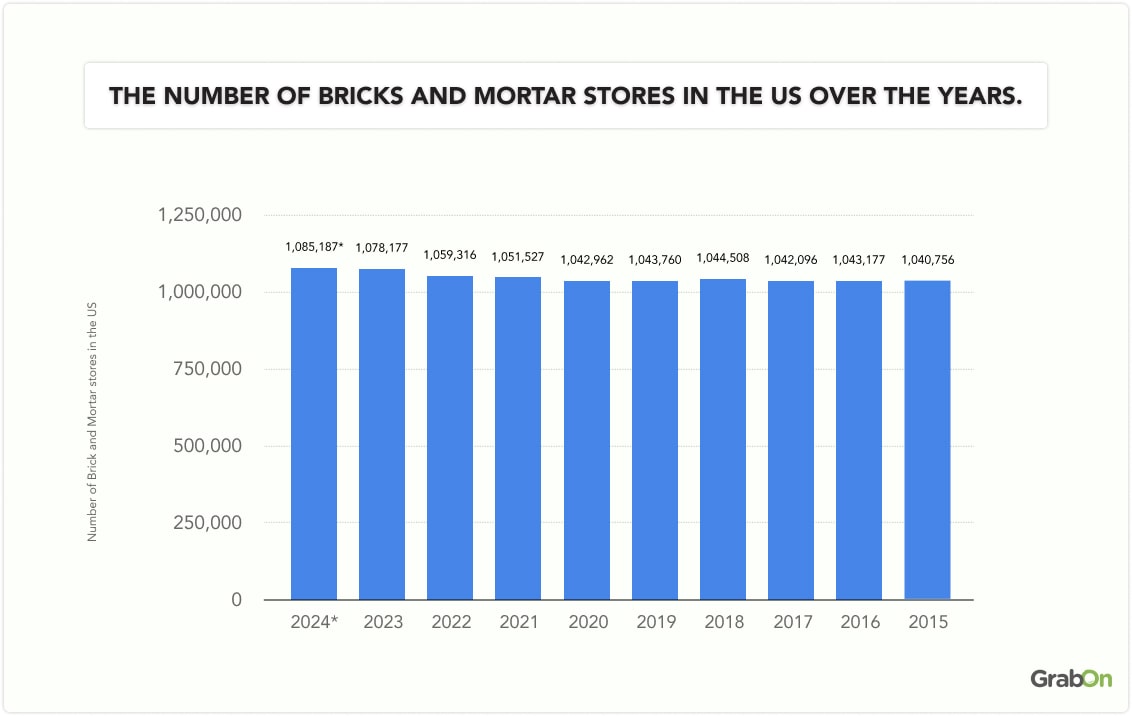
There are around 1,081,728 brick-and-mortar stores in the US as of 2025.
Here is the table to show the number of brick-and-mortar stores in the US over the years.
| Year | Number of brick-and-mortar stores in the US |
| 2025* | 1,081,728* |
| 2024 | 1,085,187 |
| 2023 | 1,078,177 |
| 2022 | 1,059,316 |
| 2021 | 1,051,527 |
| 2020 | 1,042,962 |
| 2019 | 1,043,760 |
| 2018 | 1,044,508 |
| 2017 | 1,042,096 |
| 2016 | 1,043,177 |
| 2015 | 1,040,756 |
Number of Brick and Mortar Stores in the US by Type
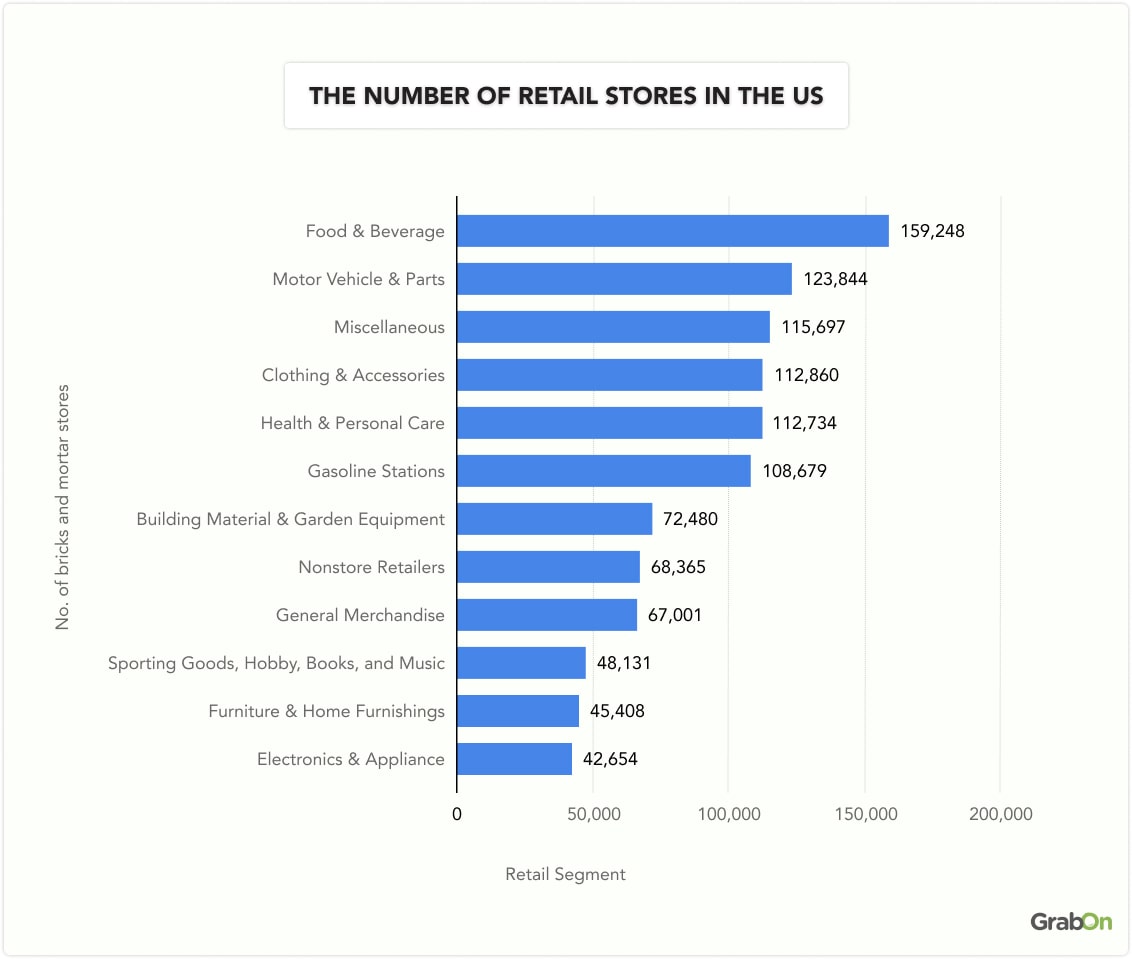
There are around 159,248 food and beverage brick-and-mortar stores in the US, followed by 123,844 motor vehicle and parts stores.
Clothing and accessories are in the 4th spot with 112,860 physical stores in the country. Electronics and appliances have the lowest number of offline stores in the US, with 42,654 stores.
The table below shows the number of retail stores in the US by type:
| Retail Segment | Number of brick-and-mortar stores |
| Food and Beverage | 159,248 |
| Motor Vehicle and Parts | 123,844 |
| Miscellaneous | 115,697 |
| Clothing and Accessories | 112,860 |
| Health and Personal Care | 112,734 |
| Gasoline Stations | 108,679 |
| Building Material and Garden Equipment | 72,480 |
| Nonstore Retailers | 68,365 |
| General Merchandise | 67,001 |
| Sporting Goods, Hobby, Books, and Music | 48,131 |
| Furniture and Home Furnishings | 45,408 |
| Electronics and Appliances | 42,654 |
Return Rate of Brick and Mortar Stores
Brick-and-mortar stores have a return rate of about 16.9%, which is lower than the return rate for online stores. It is projected that the return rate for 2025 will be 15.8%, which is lower than the rate for the previous year. The total returns for physical stores in 2024 were $890 billion, and it is expected to decrease to $849.9 billion in 2025. Total returns in offline stores, including Buy Online, Return in Store (BORIS), amount to $495 billion.
The in-store return rate is around 10.02%, excluding BORIS returns, totaling $373 billion of the total US in-store sales. Almost half of the brick-and-mortar returns are through Buy Online, Return in Store (BORIS).
7 out of 10 Baby Boomers in the US prefer in-store returns to online returns. Gen X consumers follow closely, with 68% believing that brick-and-mortar stores offer easier return processes.
Here is the table to show the ease of in-store vs. online return process by generations:
| Age Group | In-store Returns | Online Returns |
| Gen Z | 62% | 38% |
| Millennials | 59% | 41% |
| Gen X | 68% | 32% |
| Baby Boomers | 75% | 25% |
7 out of 10 female shoppers in the US find the in-store return process easier compared to online returns, while 61% of male buyers feel the same way.
Brick and Mortar store demographics
Brick-and-mortar stores remain the top choice for American shoppers of all genders. They are popular across rural, suburban, and urban areas. Gen Z and millennials also lead the way in shopping at these physical stores. Here are some of the key brick-and-mortar store demographics statistics you should know:
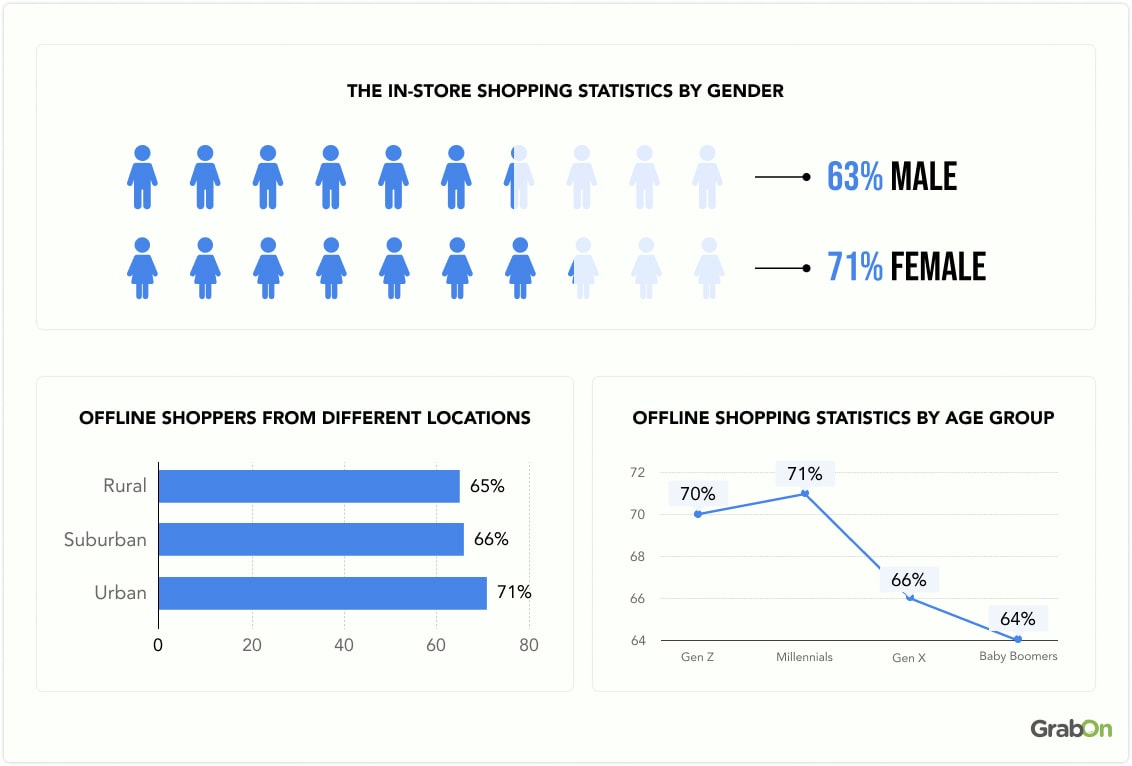
Brick and Mortar shopping statistics by gender
7 out of 10 female buyers in the United States prefer shopping in brick-and-mortar stores, while 63% of male shoppers do the same.
Grocery is the top choice among US female shoppers, with 68% preferring to buy from brick-and-mortar stores, compared to 56% of male shoppers.
The table below shows the in-store shopping statistics by gender:
| Male | 63% |
| Female | 71% |
Brick and Mortar shopping statistics by community
71% of urban shoppers in the US prefer local brick-and-mortar stores, compared to 66% of suburban Americans who choose offline stores.
Another 65% of shoppers from rural areas like shopping at physical stores rather than online platforms.
Let's check the share of offline shoppers from different locations:
| Locations | Share of shoppers opting for offline shopping |
| Rural | 65% |
| Suburban | 66% |
| Urban | 71% |
Brick and Mortar shopping statistics by age
7 out of 10 Gen Z and millennials in the United States prefer shopping in physical stores. Flowing closely, 66% of Gen X and 64% of Baby Boomers also enjoy shopping in brick-and-mortar stores.
Reports suggest that about 45% of young Americans prefer BOPIS (Buy Online, Pick Up In-store) over buying directly from physical stores. Whereas, 20% of shoppers aged above 54 years opt for the same.
Here is the table to show offline shopping statistics by age group:
| Age Group | Share of Shoppers opting for in-store shopping |
| Gen Z | 70% |
| Millennials | 71% |
| Gen X | 66% |
| Baby Boomers | 64% |
Brick and Mortar store employee statistics
There are over 17,912,647 brick-and-mortar store employees in the US as of 2025. Food and beverage stores employ over 3,249,600 Americans, followed by general merchandise stores with 3,180,400 employees.
Electronics and appliance retailers have the lowest number of employees, with 419,800 individuals working there.
Let's check the number of employees by retail segments:
| Retail Segments | No. of Employees |
| Food and Beverage | 3,249,600 |
| General Merchandise | 3,180,400 |
| Motor Vehicle and Parts | 2,038,700 |
| Sporting Goods, Hobby, Books, and Music | 1,533,000 |
| Building Material and Garden Equipment | 1,372,300 |
| Clothing and Accessories | 1,136,500 |
| Health and Personal Care | 1,106,700 |
| Gasoline Stations | 1,075,300 |
| Miscellaneous | 869,200 |
| Furniture and Home Furnishings | 432,500 |
| Electronics and Appliances | 419,800 |
Brick and Mortar store buyer behavior
8 out of 10 US shoppers prefer shopping at brick-and-mortar stores and spend around 54 minutes in a physical store inspecting and purchasing products. Around 71% of Americans living on the outskirts of cities prefer brick-and-mortar due to delivery issues from e-commerce retailers.
Americans shop at shopping malls an average of 7.5 times a month, which is about 3x than their online shopping frequency.
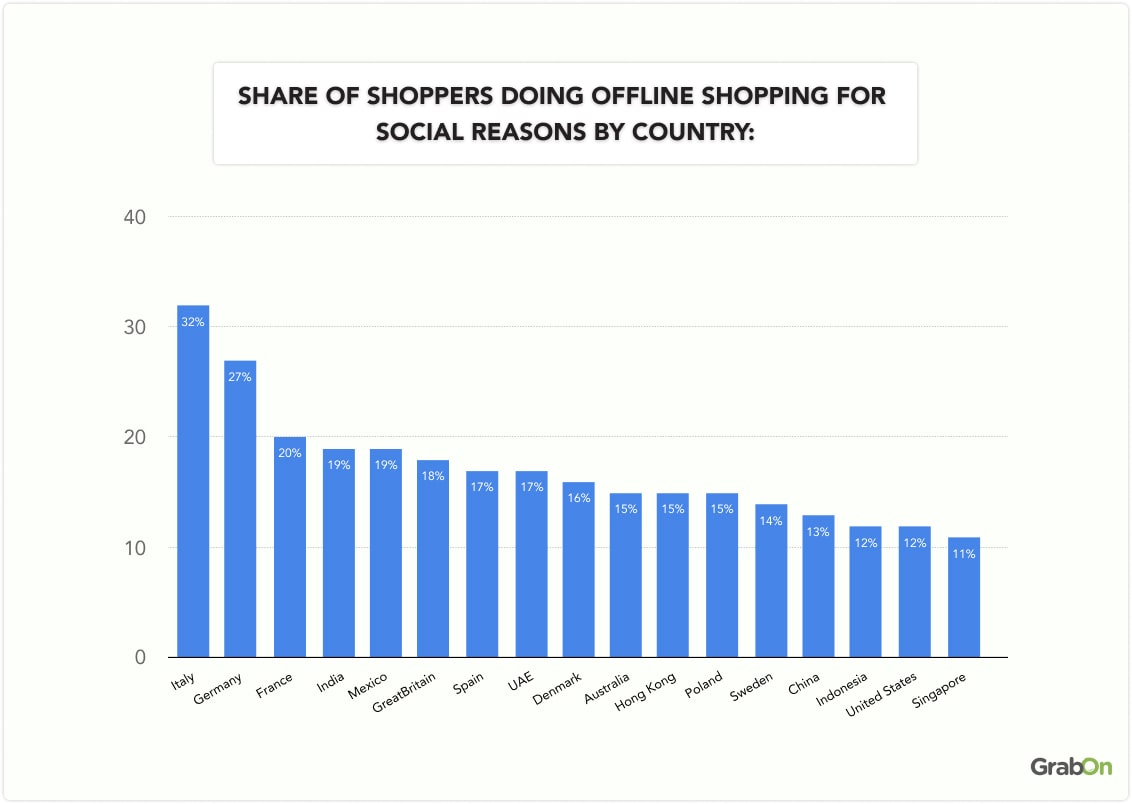
3 out of 10 Italian shoppers prefer to purchase from brick-and-mortar stores because they like shopping with others, compared to 27% of consumers in Germany who feel the same way.
Only 11% of shoppers in Singapore favor offline shopping for social reasons.
Let's check the share of shoppers doing offline shopping for social reasons by country:
| Country | Share of shoppers doing in-store purchases for social reasons |
| Italy | 32% |
| Germany | 27% |
| France | 20% |
| India | 19% |
| Mexico | 19% |
| Great Britain | 18% |
| Spain | 17% |
| UAE | 17% |
| Denmark | 16% |
| Australia | 15% |
| Hong Kong | 15% |
| Poland | 15% |
| Sweden | 14% |
| China | 13% |
| Indonesia | 12% |
| United States | 12% |
| Singapore | 11% |
Top categories in Bricks and Mortar stores
7 out of 10 Americans prefer purchasing groceries from physical stores. While 52% and 44% of consumers buy clothes and medicines from brick-and-mortar stores.
Only 12% of US shoppers prefer buying home decorative items offline, the lowest among all the retail segments.
Like Americans, 72% of Canadians prefer shopping for groceries offline. However, 60% of Chinese consumers buy clothes and accessories from physical stores.
Let's check out the most common in-store purchases in the US by type:
| Retail Type | Number of Americans Making Offline Purchases |
| Grocery store/supermarket | 68% |
| Clothing store | 52% |
| Pharmacy | 44% |
| Department store | 42% |
| Convenience store | 38% |
| Drugstore/perfumery | 32% |
| Wholesale store | 27% |
| Electronics store | 25% |
| Sports store | 19% |
| DIY/garden store | 19% |
| Farmers market | 19% |
| Book store | 18% |
| Furniture store | 16% |
| Jewelry store | 16% |
| Home decoration store | 12% |
| None of them | 11% |
Over 74% of shoppers in the US search for information about their preferred brick-and-mortar stores before visiting them. Another 6 out of 10 buyers visit a physical store to check the quality of the product before purchasing it online.
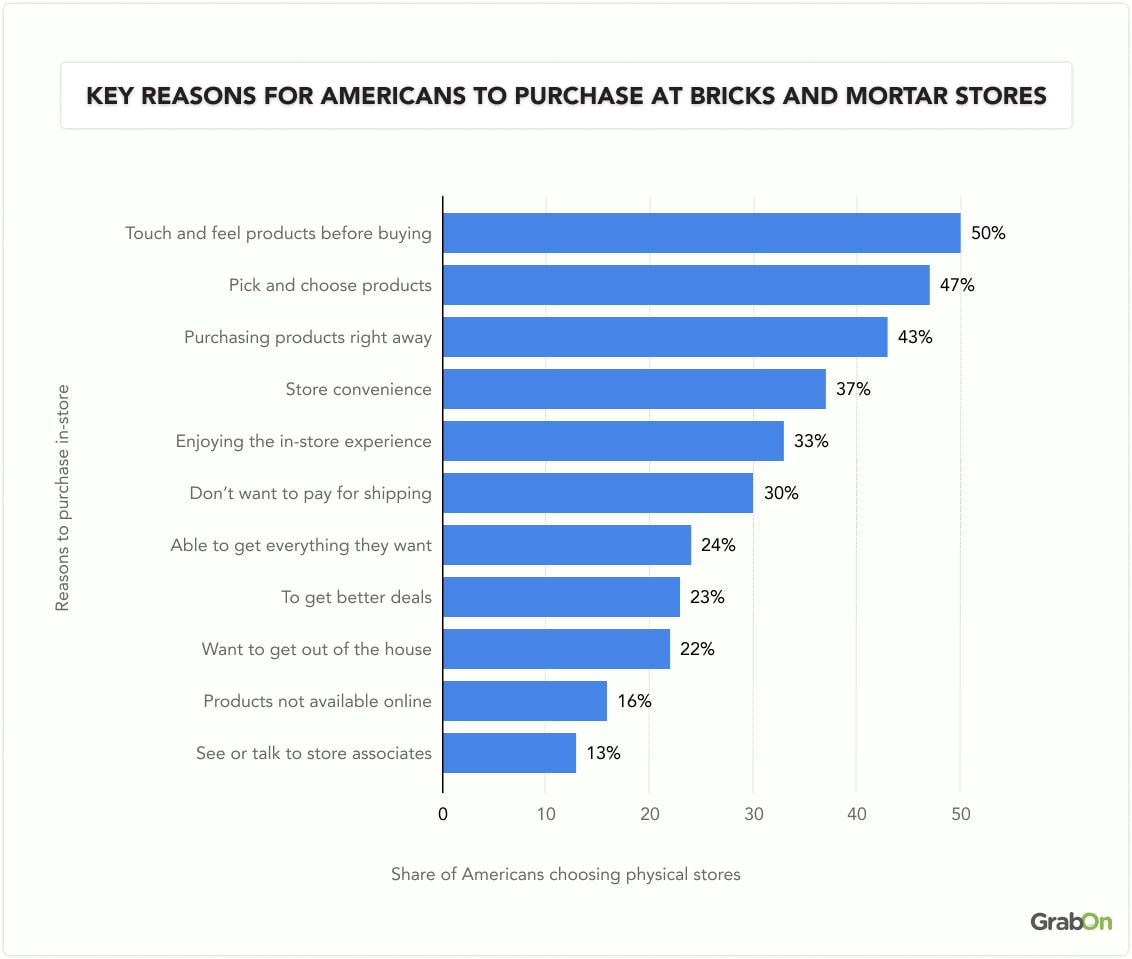
What are the reasons to shop in-store?
Half of in-store shoppers prefer to test products before buying them, while 47% opt to purchase in-store to personally choose their preferred items.
The table below shows the key reasons for Americans to purchase at brick-and-mortar stores:
| Reasons to purchase in-store | Share of Americans choosing physical stores |
| Touch and feel products before buying | 50% |
| Pick and choose products | 47% |
| Purchasing products right away | 43% |
| Store convenience | 37% |
| Enjoying the in-store experience | 33% |
| Don't want to pay for shipping | 30% |
| Able to get everything they want | 24% |
| To get better deals | 23% |
| Want to get out of the house | 22% |
| Products not available online | 16% |
| See or talk to store associates | 13% |
Where do Americans shop offline?
More than half of the US shoppers prefer making offline purchases at Walmart. Target and Home Depot follow closely, with 25% of individuals selecting them for their in-store shopping. Walgreens and Lowe’s are in the 4th and 5th spots in the list, as 22% and 20% of Americans make offline purchases from these stores, respectively.
Apple attracts only 3% of buyers to purchase its products from offline stores.
Here is the table to showcase the most popular destinations for Americans to perform offline shopping:
| Retail Chains | Share of Americans doing offline purchases |
| Walmart | 53% |
| Target | 25% |
| Home Depot | 25% |
| Walgreens | 22% |
| Lowe’s | 20% |
| Kroger | 16% |
| Costco | 16% |
| Sam’s Club | 15% |
| Kohl’s | 13% |
| Best Buy | 10% |
| Specialty, independent, local, or boutique | 8% |
| Macy's | 7% |
| Amazon Go | 7% |
| Apple | 3% |
Brick and Mortar vs eCommerce Statistics
Around 80% of the total retail sales globally come from brick-and-mortar stores, with over 1/3rd of shoppers in most countries still favoring physical stores. Consumers also prefer online stores over physical stores to purchase groceries. Let's check some of the important brick-and-mortar vs. e-commerce statistics:
Brick and Mortar vs Online Retail Sales Revenue
The total retail sales worldwide clocked $32.4 trillion in 2025. Predictions indicate it will reach $32.76 trillion in 2026 and exceed $34.9 trillion by 2026.
The share of brick-and-mortar sales is around 79.9% of the total retail sales worldwide, with online sales accounting for the remaining 20.1%.
Forecasts suggest that in-store sales could decrease further, reaching 78.2% by 2026. This gradual decrease is mainly due to the rise of the e-commerce industry.
Source: Statista 1, Statista 2
Brick and Mortar vs eCommerce Sales by Country
4 out of 10 Americans mostly do online shopping, while around 27% prefer in-store shopping. In the UK, 35% of shoppers mostly shop online, and 26% prefer offline shopping.
Only 23% of shoppers in Austria tend to shop online, and 38% of them like to purchase from physical stores.
Here is the table to showcase the share of in-store and online sales by different countries:
| Country | Online Shopping | In-store Shopping |
| United States | 43% | 27% |
| UK | 35% | 26% |
| Ireland | 32% | 35% |
| Australia | 32% | 35% |
| Germany | 33% | 25% |
| Austria | 23% | 38% |
| Netherlands | 29% | 29% |
| Belgium | 27% | 34% |
| France | 31% | 32% |
| Sweden | 35% | 25% |
| Norway | 27% | 32% |
| Finland | 28% | 35% |
| New Zealand | 25% | 39% |
| Italy | 37% | 25% |
| Poland | 29% | 30% |
| Portugal | 29% | 36% |
| Spain | 32% | 30% |
Brick and Mortar vs eCommerce Sales Buyer Behavior
6 out of 10 millennials in the US prefer purchasing groceries online, and only 22% of them shop at physical stores.
The reports indicate that only 43% of Gen Z shoppers prefer to buy groceries online, while 42% opt for in-store purchases.
The table below shows the preference of millennials and Gen Z buyers to purchase groceries:
| Generation | % of buyers doing online purchases | % of buyers doing in-store purchases |
| Gen Z | 43% | 42% |
| Millennials | 61% | 22% |
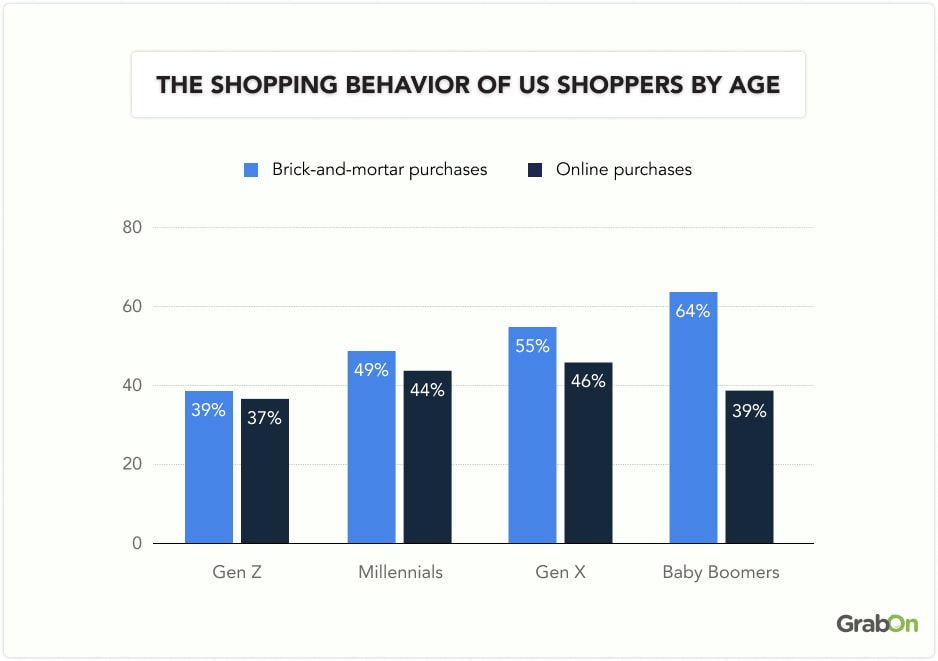
Over half of Gen X and Boomer shoppers in the US shopped from brick-and-mortar stores on a daily/weekly basis, compared to about 39% of Gen Z shoppers who prefer offline shopping over online.
Millennials split their purchases equally between physical and online stores, with 49% favoring brick-and-mortar shops and 44% opting for e-commerce platforms.
The table below shows the shopping behavior of US shoppers by age:
| Age | Brick-and-mortar purchases | Online Purchases |
| Gen Z | 39% | 37% |
| Millennials | 49% | 44% |
| Gen X | 55% | 46% |
| Boomers | 64% | 39% |
Conclusion
Brick-and-mortar stores remain one of the top shopping destinations for Americans, accounting for over 80% of the United States’ total retail sales. These sales are expected to grow by 8.10% in 2025 and surpass $8.94 trillion by 2026. However, with the rise of the e-commerce industry, the share of offline sales has been decreasing in recent years.
Looking forward, offline retailers have introduced various smart features and are working on integrating AI into their day-to-day operations to improve customers' shopping experience. Some retailers have also adopted the BOPIS and BORIS features to increase customer footfall. With these positive developments in the brick-and-mortar sector, it is likely to remain the largest contributor to U.S. retail sales.
FAQs
What company has the most brick-and-mortar stores in the US?
Walmart operates over 4,606 physical stores across the United States and more than 10,771 locations globally, making it the world's largest retail chain. Target is the second-largest retail brand in the US by store count, with over 1,981 stores.
What is the brick-and-mortar or retail sales trend in 2025?
The National Retail Federation predicts that United States retail sales will grow by 2.7% to 3.7% in 2025 compared to 2024. This projected growth rate aligns with the pre-pandemic 10-year average yearly growth rate of 3.6%.
What is the difference between BOPIS and BODFS in the brick-and-mortar industry?
BOPIS (Buy Online, Pick Up In-Store) allows you to shop online and pick up your orders at a nearby store, offering convenience and quick access. Buy Online, Deliver From Store (BODFS) utilizes local store inventory to deliver online orders more quickly to customers’ homes.
How big is the brick-and-mortar market in 2025?
In 2025, the global brick-and-mortar retail market is estimated to reach around $22.7 trillion. Out of which, the brick-and-mortar market of the USA will cross $8.27 trillion by the end of this year.