Lowe’s Statistics: Stores, Shoppers and Financials (2025)
Lowe's is a prominent Fortune 50 company and the second-largest home improvement retailer in the world. Founded in 1921, Lowe's has grown into a significant player in the industry, operating 1,753 stores across the United States and employing a workforce of 270,000 people.
The company generates over $86 billion in annual sales, with its stores covering approximately 195 million square feet and offering a wide selection of home improvement products. Each week, Lowe's manages around 16 million customer transactions.
In this blog, we will take a closer look at Lowe's operational strategies, market influence, and how it continues to maintain its leading position in the home improvement sector.
Lowe's Statistics 2025 (Editor's Picks)
- Lowe's handles around 16 million customer transactions each week in the U.S.
- Lowe's expects comparable sales in 2024 to be 2% to 3% lower than in 2023.
- Lowe's total sales for the fiscal year 2025 were approximately $83.6 billion.
- Lowe's capital expenditure is approximately $2 billion.
- As of Q2, 2025, Lowe's operated a total of 1,753 stores.
- Customers spent an average of $103.51 at Lowe's.
- Lowe’s has a household penetration rate of about 59%.
Lowe’s Company Overview
| Company | Lowe's Companies, Inc. |
| Industry | Retail |
| Foudners | Lucius Smith Lowe |
| Founded | March 25, 1921, 104 years ago, in North Wilkesboro, North Carolina, United States |
| Headquarters | Mooresville, North Carolina, United States |
| Number of employees | Over 270,000 |
How many Lowe's stores are there
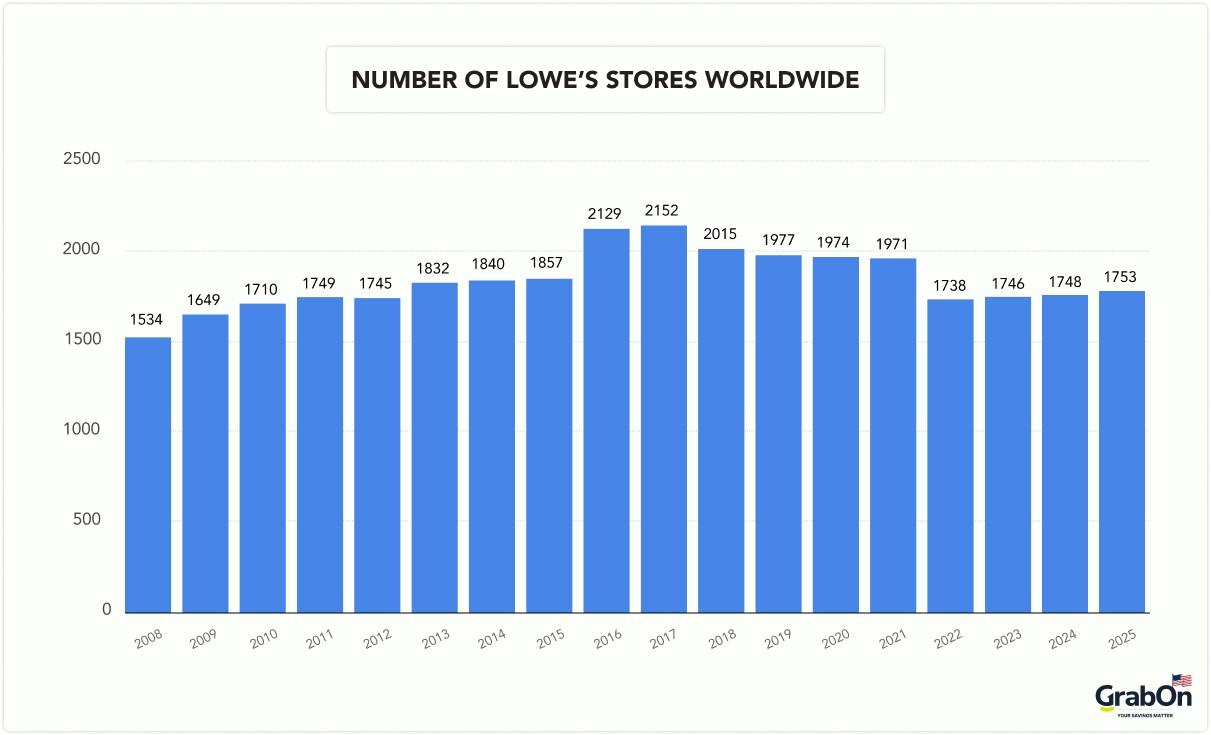
As of Q2 2025, Lowe’s operated 1,753 stores worldwide, showing a slight increase of 5 stores compared to 1,748 stores in 2024. This small rise suggests stability in the company’s physical store footprint after a period of restructuring and adjustments in previous years.

Here is a table displaying the number of Lowe’s stores worldwide
| Year | No. of Lowe's stores (Worldwide) |
| 2008 | 1,534 |
| 2009 | 1,649 |
| 2010 | 1,710 |
| 2011 | 1,749 |
| 2012 | 1,745 |
| 2013 | 1,832 |
| 2014 | 1,840 |
| 2015 | 1,857 |
| 2016 | 2,129 |
| 2017 | 2,152 |
| 2018 | 2,015 |
| 2019 | 1,977 |
| 2020 | 1,974 |
| 2021 | 1,971 |
| 2022 | 1,738 |
| 2023 | 1,746 |
| 2024 | 1,748 |
| 2025 Q2 | 1753 |
Source: Statista
Lowe's Has 120 Supply Chain Facilities Supporting Its Operations
Lowe’s operates a strong and efficient supply network with over 120 supply chain facilities across its system. These facilities play a key role in ensuring that products are delivered quickly and reliably to stores and customers, helping Lowe’s meet demand and keep operations running smoothly every day.
Source: Lowe’s
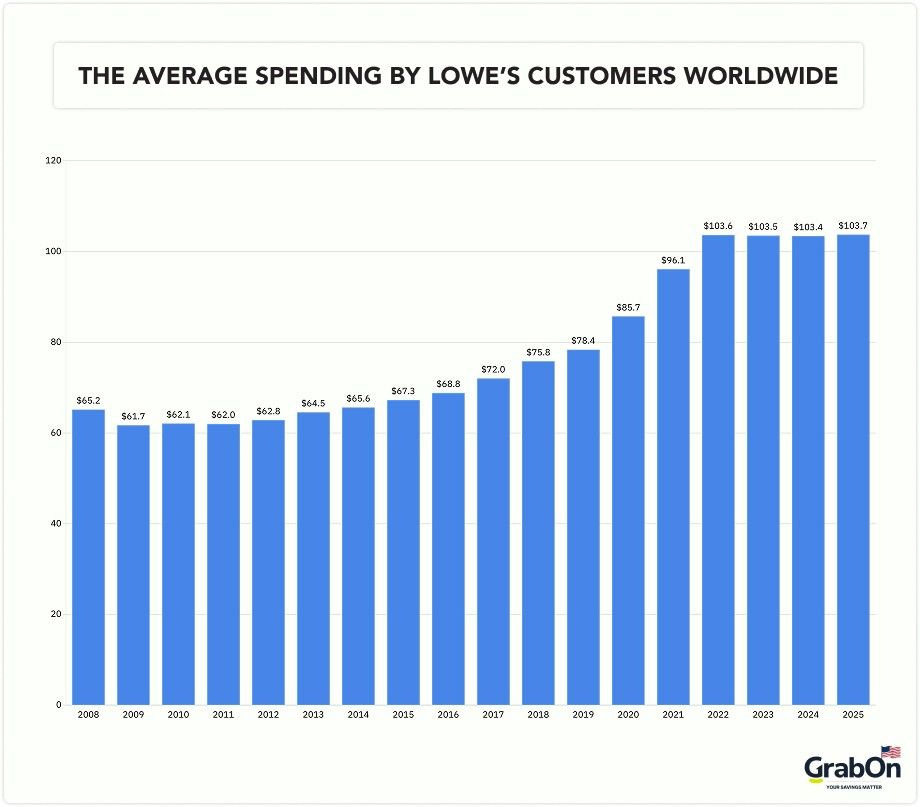
Average Spending by Lowe’s Customers Worldwide
In 2025, the average amount spent by Lowe's customers worldwide stood at $103.73, a slight increase from $103.37 in 2024. This reflects a modest rise of 0.35%. Over the past decade, average spending has steadily grown, rising from $65.15 in 2008 to over $100 in recent years, with occasional fluctuations like the slight dip in 2023.
Customers can further reduce their expenses by applying Lowe’s Promo Codes during their purchases.
Below is the table showing the average spending by Lowe's customers worldwide
| Year | The average amount spent by Lowe's Customers |
| 2008 | $65.15 |
| 2009 | $61.66 |
| 2010 | $62.07 |
| 2011 | $62 |
| 2012 | $62.82 |
| 2013 | $64.52 |
| 2014 | $65.61 |
| 2015 | $67.26 |
| 2016 | $68.83 |
| 2017 | $72 |
| 2018 | $75.79 |
| 2019 | $78.36 |
| 2020 | $85.69 |
| 2021 | $96.09 |
| 2022 | $103.64 |
| 2023 | $103.51 |
| 2024 | $103.37 |
| 2025 | $103.73 |
Source: Statista, Lowes 2023 Annual Report
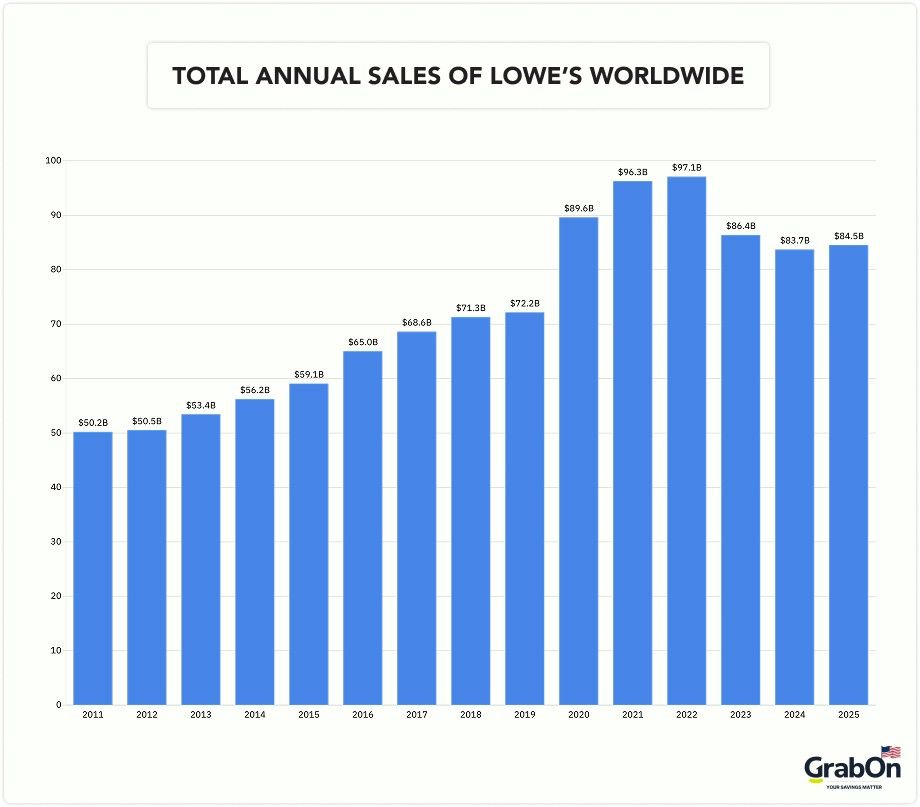
Annual sales of the Lowe's worldwide
In 2025, Lowe's total annual sales worldwide are estimated to be between $84.5 and $85.5 billion, showing a slight increase of $0.8 to $1.8 billion, compared to $83.7 billion in 2024.
Overall, the 2025 estimate demonstrates that Lowe's continues to maintain a strong global presence, with sales stabilizing after minor declines. This steady performance highlights the company's ability to sustain customer demand and remain a key player in the retail home improvement market.
Below is the table displaying the total annual sales of Lowe’s worldwide
| Year | Total Annual Sales of Lowe's Worldwide |
| 2011 | $50.21 Billion |
| 2012 | $50.52 Billion |
| 2013 | $53.42 Billion |
| 2014 | $56.22 Billion |
| 2015 | $59.07 Billion |
| 2016 | $65.02 Billion |
| 2017 | $68.62 Billion |
| 2018 | $71.31 Billion |
| 2019 | $72.15 Billion |
| 2020 | $89.6 Billion |
| 2021 | $96.25 Billion |
| 2022 | $97.1 Billion |
| 2023 | $86.38 Billion |
| 2024 | $83.7 Billion |
| 2025 | $84.5 to $85.5 Billion |
Source: Statista, Lowes 2023 Annual Report
Lowe's has approximately $443 in sales per square foot in the U.S.
Lowe’s generates around $443 in sales per square foot in the U.S. This metric shows how well the company uses its store space to generate revenue, highlighting its effectiveness in boosting sales per square foot.
Source: Statista
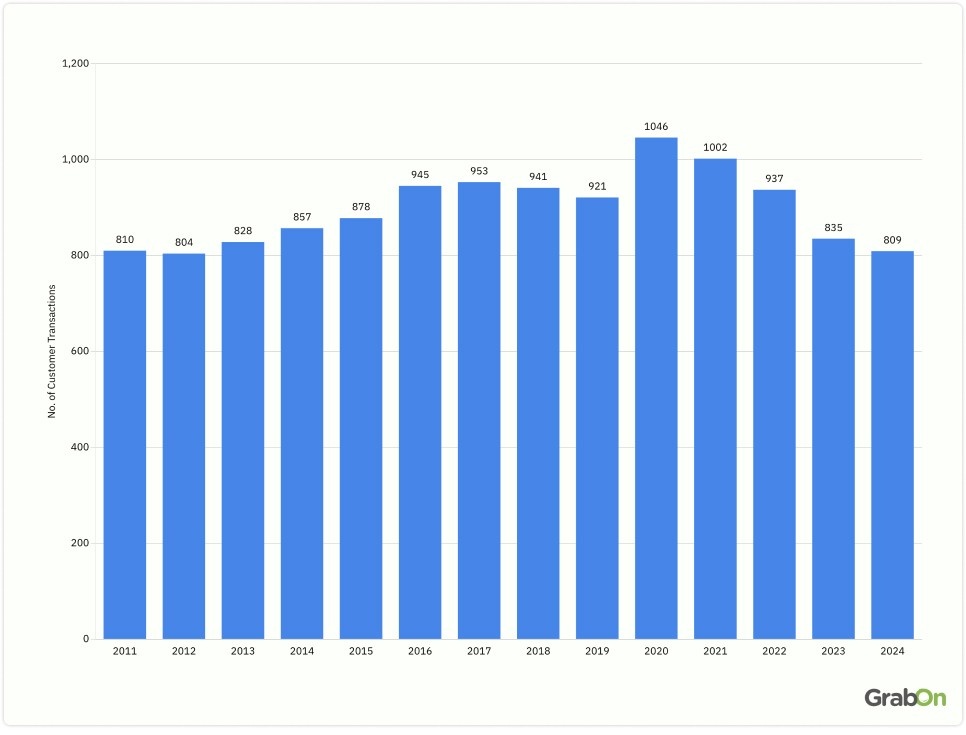
Number of customer transactions at Lowe’s worldwide
In 2024, Lowe's recorded 809 million customer transactions worldwide, which is a slight decline from 835 million transactions in 2023. This represents a decrease of about 3.1% compared to the previous year.
This drop can be attributed to several factors, including a shift in consumer spending habits due to inflation and economic uncertainty, leading many shoppers to cut back on non-essential home improvement projects.
Looking at the broader trend, Lowe's customer transactions grew steadily from 810 million in 2011 to a peak of over 1 billion in 2020. For the end of 2025, if current patterns continue, Lowe's may see transactions stabilize around 800 million.
Below is the table showing the number of customer transactions at Lowe’s worldwide
| Year | No. of Customer Transactions |
| 2011 | 810 Million |
| 2012 | 804 Million |
| 2013 | 828 Million |
| 2014 | 857 Million |
| 2015 | 878 Million |
| 2016 | 945 Million |
| 2017 | 953 Million |
| 2018 | 941 Million |
| 2019 | 921 Million |
| 2020 | 1,046 Million |
| 2021 | 1,002 Million |
| 2022 | 937 Million |
| 2023 | 835 Million |
| 2024 | 809 Million |
Source: Statista, Lowes 2023 Annual Report
Global net sales of Lowe’s by product category
In 2024, Lowe's global net sales across product categories show that Appliances generated the highest sales, at $12,344 million, followed by Seasonal and Outdoor Living, at $7,740 million, and Lumber, at $7,020 million. Other notable categories included Kitchen and bath, at $6,167 million, and Hardware, at $5,828 million. Building Materials generated $5,245 million, while Millwork reached $5,181 million.
Lowe’s 2024 performance saw a broad distribution of sales across various categories, with significant contributions from key areas such as Appliances, Lumber, and Seasonal and Outdoor Living.
Below is the table displaying Lowe's global net sales by product category
| Product Category | 2022 | 2023 | 2024 |
| Appliances | 13,054 | 13,183 | 12,344 |
| Seasonal and Outdoor Living | 8,797 | 8,244 | 7,740 |
| Lumber | 8,181 | 8,289 | 7,020 |
| Lawn and Garden | 7,154 | 6,663 | 6,729 |
| Kitchen and Bath | 6,378 | 6,618 | 6,167 |
| Hardware | 5,737 | 5,948 | 5,828 |
| Building Material | 4,369 | 4,948 | 5,245 |
| Millwork | 5,029 | 5,499 | 5,181 |
| Paint | 4,942 | 5,273 | 5,118 |
| Rought Plumbing | 4,466 | 5,088 | 4,971 |
| Tools | 5,198 | 5,014 | 4,723 |
| Electrical | 4,938 | 5,057 | 4,478 |
| Flooring | 4,734 | 4,832 | 4,327 |
| Decor | 4,894 | 4,795 | 4,175 |
| Others | 2,477 | 2,559 | 2,331 |
Source: Statista
Number of Employees at Lowe's across the world
In 2024, Lowe's has a total of 300,000 employees. This represents an increase of 16,000 employees from the 284,000 employees in 2023. Overall, the growth in employee numbers highlights Lowe's ongoing commitment to strengthening its business and meeting customer needs effectively.
The table below presents the total number of employees at Lowe’s globally
| Year | Total Number of Employees at Lowe's |
| 2017 | 310,000 |
| 2018 | 300,000 |
| 2019 | 320,000 |
| 2020 | 340,000 |
| 2021 | 340,000 |
| 2022 | 307,000 |
| 2023 | 284,000 |
| 2024 | 300,000 |
Source: Statista
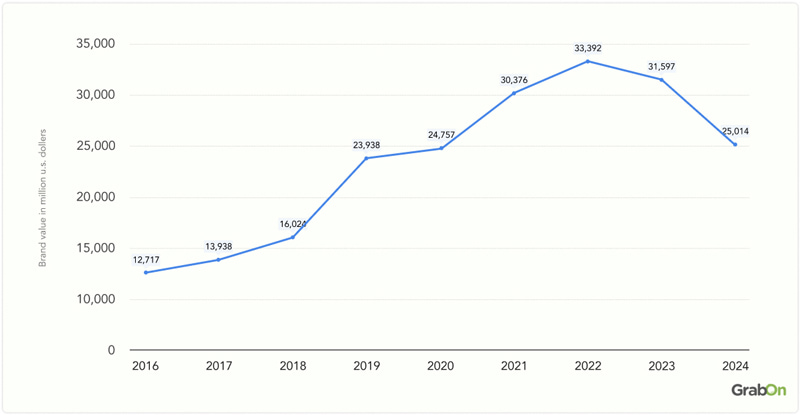
Lowe's Brand Value
In 2024, Lowe’s brand value stood at $25,014 million. Despite some fluctuations over the years, Lowe’s continues to hold a high brand value, demonstrating its robust market position.
Looking ahead, Lowe’s brand value in 2025 could potentially reach around $28,000 to $32,000 million.
The table below displays the global brand value of Lowe’s
| Year | Lowe's Brand Value |
| 2016 | $12,717 Million |
| 2017 | $13,938 Million |
| 2018 | $16.024 Million |
| 2019 | $23,938 Million |
| 2020 | $24, 575 Million |
| 2021 | $30,376 Million |
| 2022 | $33,392 Million |
| 2023 | $31,597 Million |
| 2024 | $25,014 Million |
Source: Statista
Lowe's is world's fifth most valuable retail brand in the world
Lowe’s holds the fifth position with a brand value of $26,612 million. Amazon is the most valuable retail brand globally, with a value of $148,589 million, followed by The Home Depot at $74,712 million and Walmart at $69,700 million.
Overall, the rankings demonstrate the strong influence of these top retailers in shaping global retail trends and consumer preferences.
Below is the table showing the world’s most valuable retail brands
| Retail Brands | Total Brand Value |
| Amazon | $148,589 Million |
| The Home Depot | $74,712 Million |
| Walmart | $69,700 Million |
| Costco | $60,489 Million |
| Lowe's | $26,612 Million |
| Tmall | $23,337 Million |
| IKEA | $21, 937 Million |
| Aldi | $21,024 Million |
| Pinduoduo | $20,369 Million |
| Mercado Libre | $14,816 Million |
| Target | $14,156 Million |
| Taobao | $13,480 Million |
| Lidi | $13,169 Million |
| TJ-Maxx | $11,551 Million |
| Sam's Club | $11,271 Million |
| 7-Eleven | $11,068 Million |
| Woolworths | $10,827 Million |
| Ebay | $10,327 Million |
| Dollar General | $9,726 Million |
| Flipkart | $8,408 Million |
Source: Statista
Lowe's is the most recognized DIY and garden online stores in the United States
The Home Depot stands out as the most recognized brand in the U.S. DIY and garden market, with an impressive 92% brand awareness among shoppers. Right behind is Lowe's, with 90% awareness, showing that these two giants dominate the industry and remain the first choices for many customers.
Below is the table of top DIY and garden online stores by brand awareness in the U.S
| DIY and Garden Shops | % of Brand Awareness among shoppers |
| The Home Depot | 92% |
| Lowe's | 90% |
| Ace | 84% |
| TEMU | 74% |
| Harbor Freight | 65% |
| Grainger | 47% |
| Menards | 44% |
| DO it Best | 29% |
| Northern Tool + Equipments | 28% |
| Gardener's Supply Company | 23% |
| Garden Goods | 18% |
| True Leaf Market | 18% |
| HomeimprovementSupply | 17% |
| BrighterBlooms.com | 16% |
| Best Materials | 16% |
| MSC | 16% |
Source: Statista
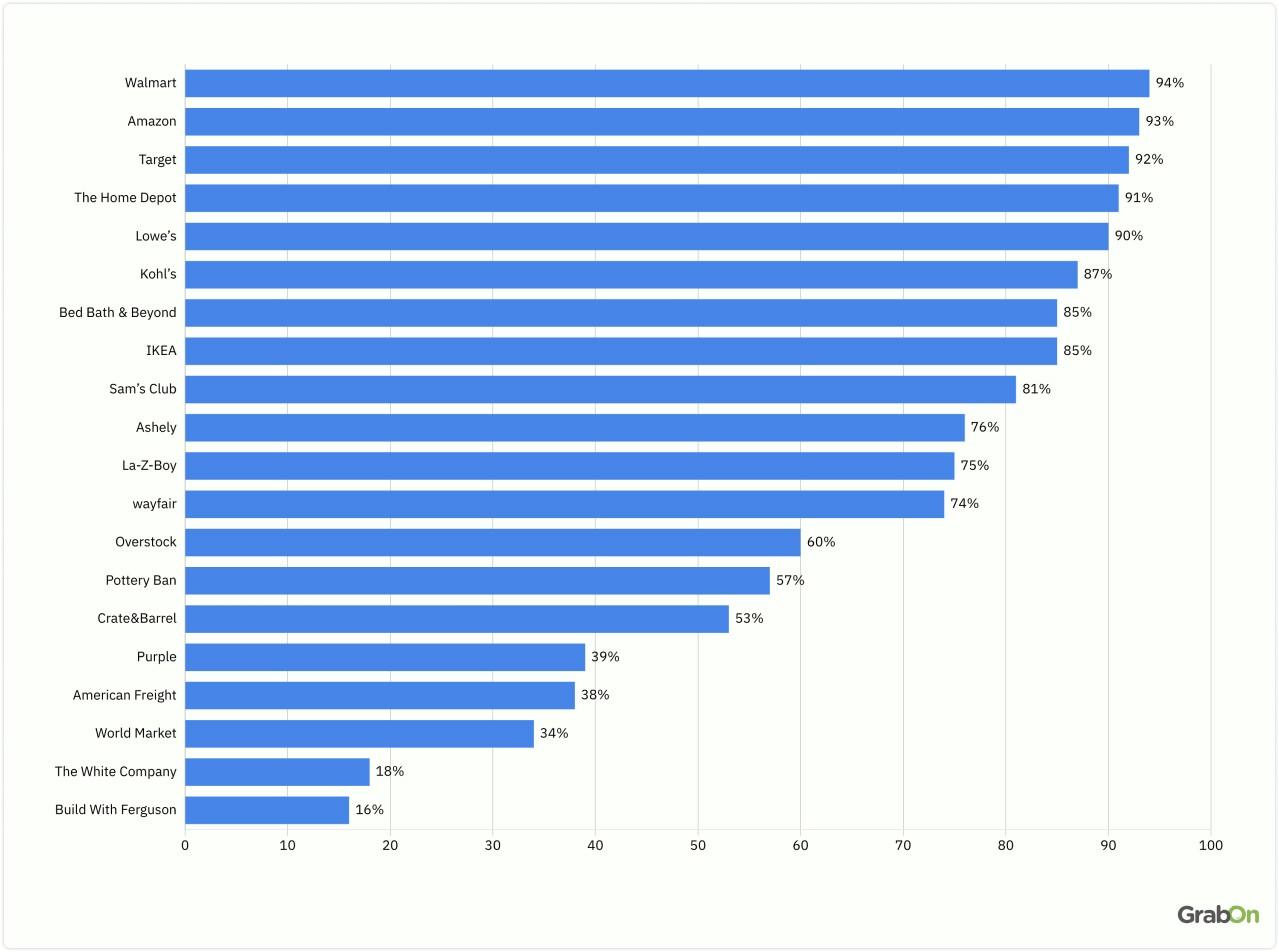
90% of US Shoppers Recognize Lowe's as a Leading Online Furniture Retailer
Walmart is the most recognized online furniture store in the U.S., with 94 percent brand awareness. It is followed closely by Amazon at 93 percent, Target at 92 percent, and The Home Depot at 91 percent. These major retailers lead the market due to their strong presence and large customer base.
Lowe's, Kohl's, Bed Bath and Beyond, and IKEA also show high brand awareness, all above 85 percent.
Below is the table showing the top online furniture stores by brand awareness in the U.S
| Top Online Furniture Stores | % of Brand Awareness among shoppers |
| Walmart | 94% |
| Amazon | 93% |
| Target | 92% |
| The Home Depot | 91% |
| Lowe's | 90% |
| Kohl's | 87% |
| Bed Bath and Beyond | 85% |
| IKEA | 85% |
| Sam's Club | 81% |
| Ashely | 76% |
| La-Z-Boy | 75% |
| wayfair | 74% |
| Overstock | 60% |
| Pottery Ban | 57% |
| CrateandBarrel | 53% |
| Purple | 39% |
| American Freight | 38% |
| World Market | 34% |
| The White Company | 18% |
| Build With Ferguson | 16% |
Source: Statista
Lowe's Buyers By Gender
7 out of 10 Lowe's shoppers are female, making them the predominant demographic on the platform. In contrast, male users constitute 25% of the user base.
Here is the breakdown of Lowe's users by gender, as shown in the table
| Gender | % of Lowe's Shoppers |
| Female | 75% |
| Male | 25% |
| Unspecified | 1% |
Source: Numerator
Lowe's Shoppers by Generation
44% of Lowe's customers are Baby Boomers, the largest demographic group shopping at the store. Following them, Gen X accounts for 31% of the customer base, while Millennials represent 21%.
Gen Z represents the smallest portion, making up only 4% of Lowe's shoppers. This distribution highlights that Lowe's has a stronger appeal to older generations, particularly Baby Boomers and Gen X.
The table below displays the distribution of Quora users across various generations
| Generations | % of Lowe's Buyers |
| Gen Z | 4% |
| Millennials | 21% |
| Gen X | 31% |
| Baby Boomers | 44% |
Source: Numerator
Lowe's Shoppers by Race
71% of Lowe's shoppers are White/Caucasian, making it the largest racial group among its customers. Black or African American and Hispanic or Latino shoppers each represent 12% of the customer base.
Asian shoppers represent 4%, while 2% are categorized as “Others,” marking the smallest group. This data shows that White or Caucasian individuals form the majority of Lowe's shoppers.
The table below shows the distribution of Quora users by race
| Race | % of Lowe's Shoppers |
| White / Caucasian | 71% |
| Black or African American | 12% |
| Hispanic / Latino | 12% |
| Asian | 4% |
| Others | 2% |
Source: Numerator
Lowe’s shoppers by Age
62.6% of Lowe's shoppers fall in the 1824 age group, making it the largest segment of their customer base. The 2534 age group comes next with 16.2%, followed by 3544 years at 9.4%. In contrast, only 6.9% of shoppers are aged 55 and above, making them the smallest group. This might indicate a lower level of engagement from older customers or different shopping preferences.
The data suggests that Lowe's connects most strongly with younger shoppers, especially those aged 1824.
The table below displays the distribution of Lowe’s shoppers by various age groups
| Age Groups | % of Lowe's Buyers |
|---|---|
| 55 and Above | 6.9% |
| 45-54 Years | 4.9% |
| 35-44 Years | 9.4% |
| 25-34 years | 16.2% |
| 18-24 Years | 62.6% |
Source: Start.io
Lowe's shoppers by income
Forty-eight percent of Lowe’s shoppers come from middle-income households, earning between $40,000 and $125,000 annually, making it the largest group of customers.
High-income households account for 31%, while low-income households comprise 21%. This broad income distribution highlights Lowe's strong appeal across different financial groups.
The table below shows the income demographics of Lowe's shoppers
| Household Income | % of Lowe's Customers |
| Low Income (<$40K) | 21% |
| Middle Income ($40K – $125K) | 48% |
| High Income ($125k+) | 31% |
Source: Numerator
Lowe’s has an average repeat purchase rate of 75%.
Lowe’s boasts an average repeat purchase rate of 75%. Additionally, customers make purchases on average 9 times. This suggests strong customer loyalty and a consistent pattern of repeat business.
Source: Numerator