50+ Push Notification Statistics for 2025
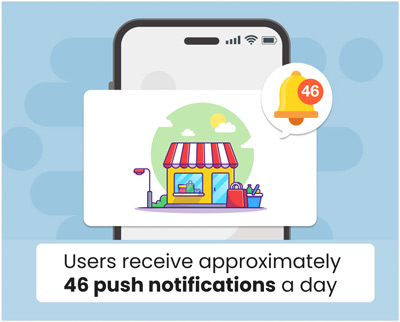
Push notifications are short, timely messages sent directly to users’ devices to provide updates, alerts, or reminders. On average, users receive about 46 push notifications daily. These notifications have become a crucial tool for engaging users and encouraging interactions across various digital platforms.
Research indicates that push notifications can boost app engagement by 88%, making them highly effective in keeping users active. They also have a delivery rate of 90%, which is 50% higher than the open rate for emails. Furthermore, push notifications have a click rate of 12%, which can be improved to 15% with the use of automation.
In this blog, we will explore the key statistics and trends associated with push notifications so you can leverage them to your advantage.
Push Notification Statistics 2025 (Editor’s Picks)
- US smartphone users receive an average of 46 push notifications daily and 70% find them useful.
- Push notifications have a 12% click rate, which can increase to 15% with automation.
- Push notifications boost app engagement by 88%.
- 65% of users return to an app within 30 days of enabling push notifications.
- Push notifications have a 50% higher open rate than email marketing.
- Around 90% of push notifications are opened by users.
- Push notifications have a 90% delivery rate.
How many push notifications do people get per day?
On average, US smartphone users receive about 46 push notifications daily. That is equivalent to one push notification by 57% of the installed apps every day, considering an average smartphone user has around 80 apps installed on their phone.
This high volume emphasizes the crucial role of push notifications in daily digital interactions. It also highlights the importance of creating engaging and relevant messages to capture users’ attention.
Source: Clevertap
Push notification frequency statistics (Demographics)
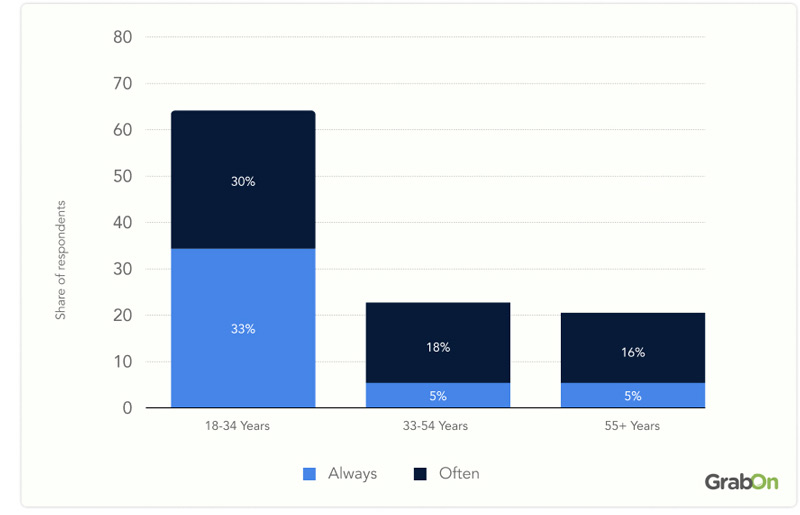
Around 33% of users aged 18 to 34 years said they always allow an app’s request for push notifications, while only 30% from that age group said they often do it.
Among users aged 35-54, 5% always allow app push notifications, while 18% often allow them. For those above 55, 5% always allow app push notifications and 16% often do so.
This data indicates that while younger users are generally more open and engaged with push notifications, older users tend to be more selective and cautious about granting permission.
The age group of users who consent to an app’s push notification requests
Source: Statista
What makes users disable push notifications?
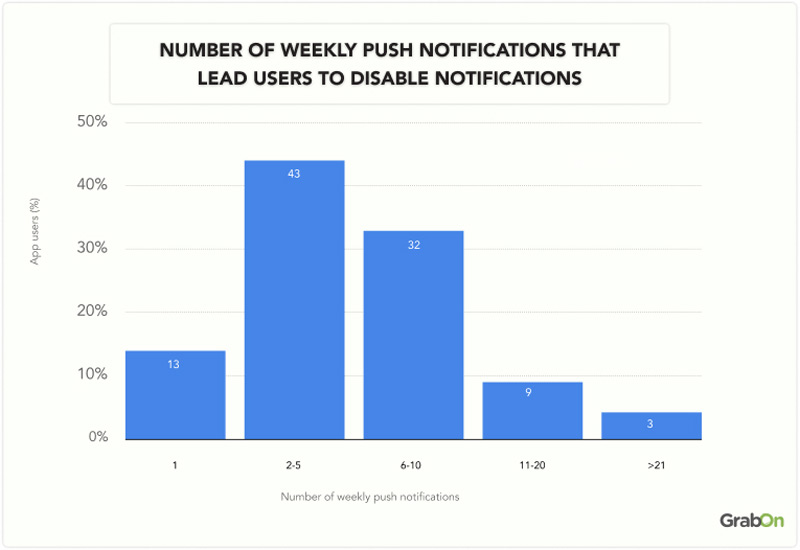
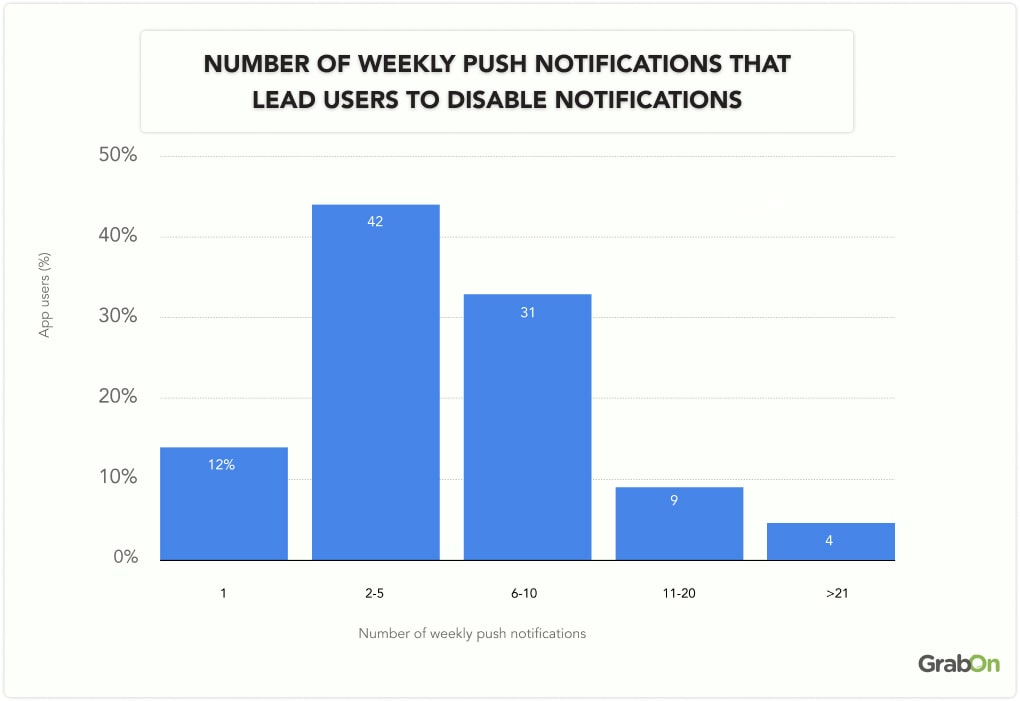
As the number of weekly push notifications increases, a significant percentage of users is likely to disable them. Specifically, 12% of app users indicated that they would turn off notifications after receiving just one push notification per week. Furthermore, 42% of app users would disable notifications if they received between 2 to 5 weekly notifications.
In addition, 31% of users will turn off notifications when they receive between 6 to 10 push notifications each week. Finally, 9% of users would disable notifications after receiving between 11 to 20 weekly push notifications.
Here is a table showing the number of weekly notifications that lead users to disable them
| No. of Weekly Push Notifications | % of App Users likely to disable push notification |
| 1 | 12% |
| 2-5 | 42% |
| 6-10 | 31% |
| 11-20 | 9% |
| Above 21 | 4% |
Source: Helplama
What do recipients find annoying about push notifications?
5 out of 10 recipients find push notifications irritating, while 49% say they are distracting. Additionally, 38.39% report that push notifications disturb them at inconvenient times. Moreover, 21% believe these notifications serve no purpose, and 12.5% find them impersonal. This shows the crucial role of timely, relevant, and personalized notifications in improving user experience and minimizing irritation.
The table shows what recipients find annoying about push notifications
| What do recipients find annoying about push | % of users and subscribers |
| They irritate me | 52.68% |
| They distract me | 49% |
| They disturb me at the wrong time | 38.39% |
| They are not relevant to me | 24.11% |
| They serve no purpose | 21% |
| They are impersonal | 12.5% |
Source: Business of Apps
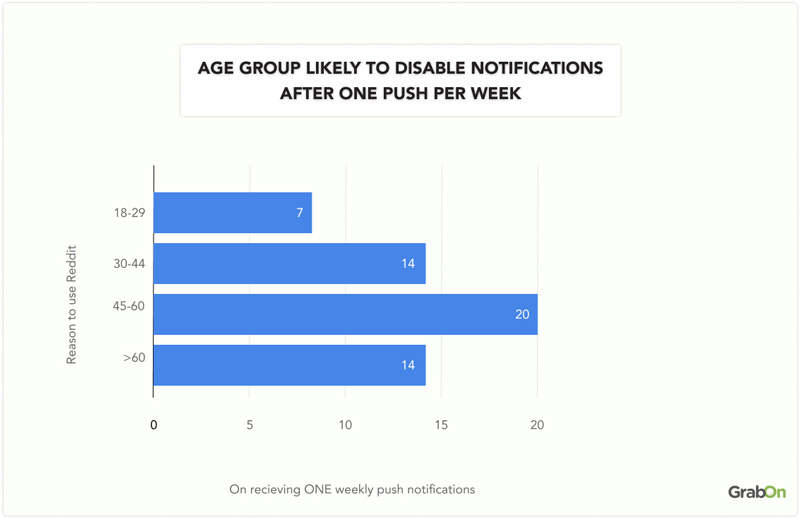
The age group of users likely to turn off notifications after one push per week
When receiving just one notification per week from a mobile app, 20% of users aged 45-60 will disable push notifications, while only 7% of users aged 18-29 will do the same.
This suggests that younger users are more tolerant of push notifications, whereas older users are more inclined to opt out with minimal prompting.
| Age Group | % of users who disable push notifications after receiving one per week |
| 18-29 | 7% |
| 30-44 | 14% |
| 45-60 | 20% |
| 60+ | 14 |
Source: Helplama
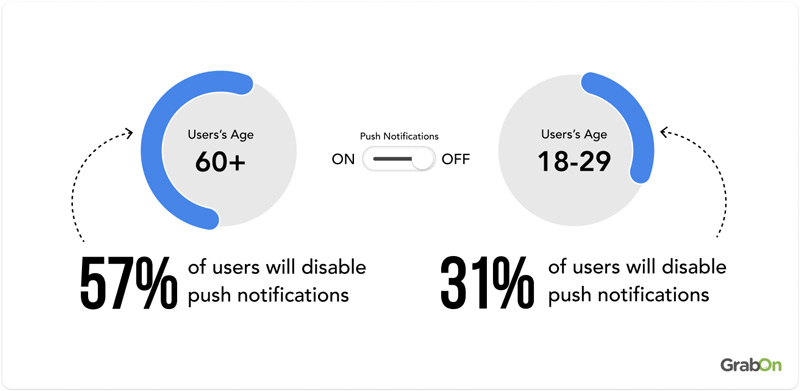
Older users are more likely to disable push notifications
57% of users over 60 are more likely to disable push notifications if they receive 2 to 5 per week. In comparison, only 31% of users aged 18 to 29 will do the same under similar conditions. This indicates that older users are more prone to turning off push notifications compared to younger users.
Source: Helplama
Number of push notifications that will lead users to stop using the app
Around 30% of users will discontinue using the app after receiving 6 to 10 notifications per week, while 28% will stop after receiving 2 to 5 notifications. Additionally, 20% of users will stop using the app after receiving 11 to 20 push notifications.
Overall, this data highlights that users are sensitive to the frequency of push notifications, with increasing numbers of notifications leading to higher rates of app abandonment.
| % of app users | Number of weekly pushes that will cause users to stop using the app |
| 8% | 1 |
| 28% | 2-5 |
| 30% | 6-10 |
| 20% | 11-20 |
| 14% | 21+ |
Source: Helplama
60% of Recipients Prefer Receiving App Push Notifications from Social Media Platforms
6 out of 10 recipients prefer receiving push notifications from social media apps, making them the most favored. News and information apps come next, with 45.94% of users favoring notifications from these sources. Notifications from travel and hotel booking apps are preferred by 10.08%, and blogs and publications attract 9.24%.
Here is a table showing which types of apps users prefer for push notifications
| Kind of Apps (To Receive push notifications) | % of Recipient’s Preference |
| Social Media | 57.42% |
| News and Information apps and websites | 45.94% |
| Shopping and Retail apps and websites | 25.29% |
| Gaming apps and websites | 19.05% |
| Travel and hotel booking apps and websites | 10.08% |
| Blogs and publications | 9.24% |
Source: Business of Apps
Push Notifications Opt-in Rates (By mobile operating systems)
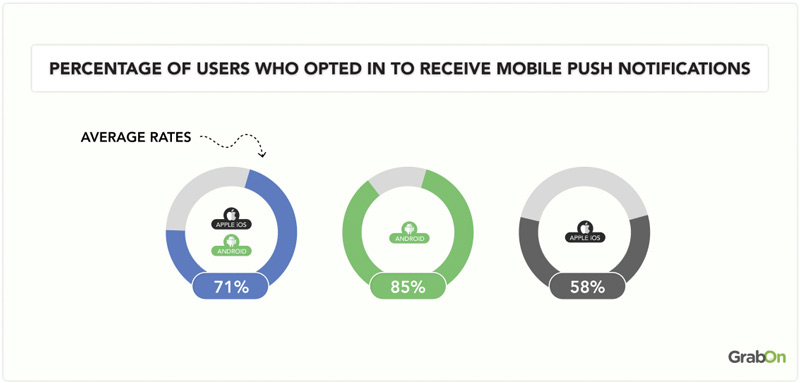
85% of Android users have chosen to receive mobile push notifications, compared to only 58% of iOS users. This higher opt-in rate on Android can be attributed to several factors. Android is particularly marketer-friendly, with push notifications enabled by default for all installed apps. This means that app publishers can send notifications unless users manually disable them or haven’t interacted with the app for several months.
In contrast, iOS requires users to explicitly opt-in before any push notifications can be sent. This opt-in prompt is mandatory and cannot be customized by app publishers, contributing to the lower opt-in rate on iOS.
Source: Batch
Push Notifications Open Rates
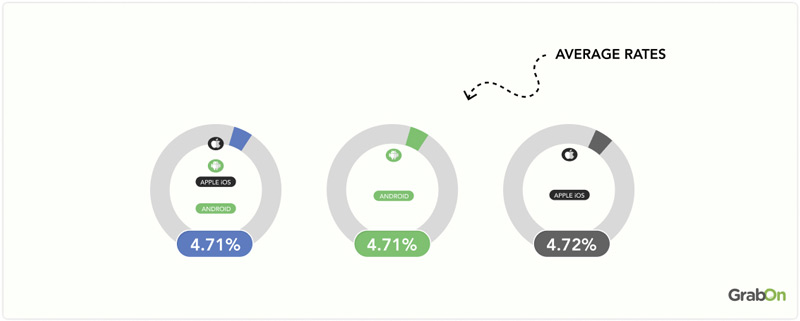
4.71% of Android users open push notifications, while approximately 4.72% of iOS users do the same. This shows that both platforms have similar engagement rates with push notifications, with iOS users being slightly more likely to open them.
Source: Batch
Push Notification Senders
eCommerce is the top sender of push notifications, making up 22.03% of all notifications. Media, publishing, and blogging come next at 18.79%, followed by industries like BFSI and software/SaaS. These sectors use push notifications to stay connected with users and drive engagement.
Overall, these numbers indicate that push notifications are widely used across various sectors, with e-commerce and media companies being the most active.
| Industry | Percentage of push notifications |
| eCommerce | 22.03% |
| Media, Publishing, Blogging | 18.79% |
| BFSI | 8.35% |
| Software and SAAS | 7.62% |
| Digital Marekting Agencies | 7.52% |
| Arts / Sports / Entertainment | 6.89% |
| Education / eLearning | 6.37% |
| Healthcare / Wellness | 5.01% |
| Others | 4.91% |
| Gaming | 4.8% |
| Careers / Training | 2.71% |
| Travel / Hospitality | 2.61% |
| Online Directories / Aggregators | 2.4% |
Source: Business of Apps
Push Notification Open Rates by Day of the Week
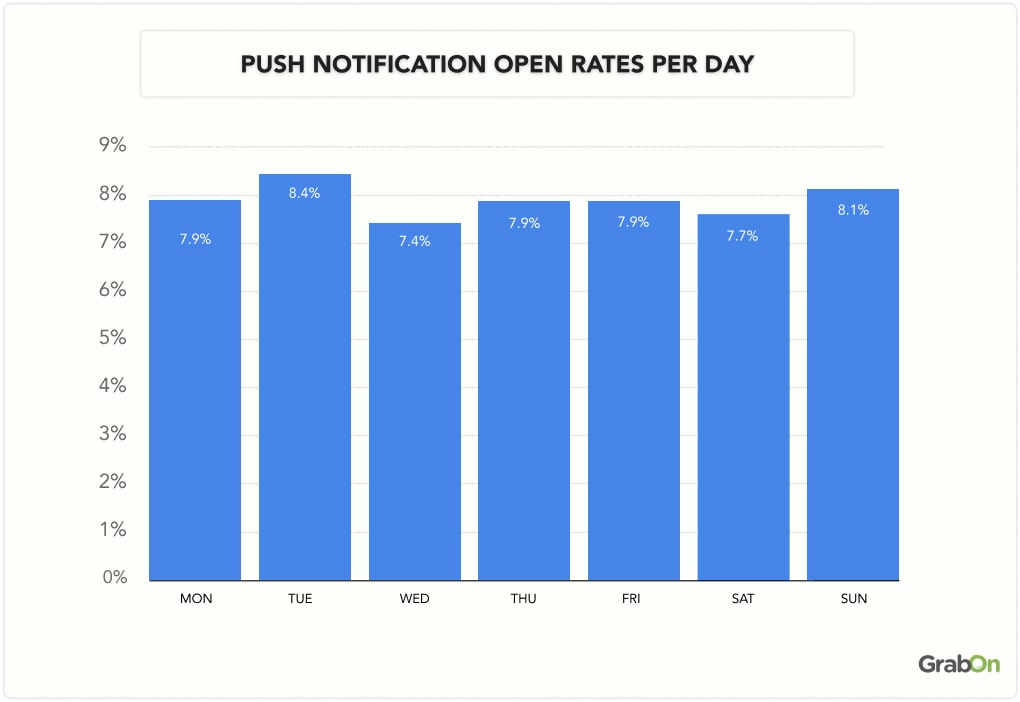
Tuesday and Sunday have the highest open rates for push notifications, averaging 8.4% and 8.1%, respectively, indicating peak user engagement on these days. Monday and Thursday follow closely with open rates of 7.9% each. Saturday (7.7%) and Wednesday (7.4%) also maintain relatively strong engagement.
Friday has the lowest open rate at 7.9%, suggesting it is the least effective day for engaging users with push notifications.
| Day | Push Notification open rates |
| Monday | 7.9% |
| Tuesday | 8.4% |
| Wednesday | 7.4% |
| Thursday | 7.9% |
| Friday | 7.9% |
| Saturday | 7.7% |
| Sunday | 8.1% |
Source: Batch
Push Notification Open Rates by Hour of the Day
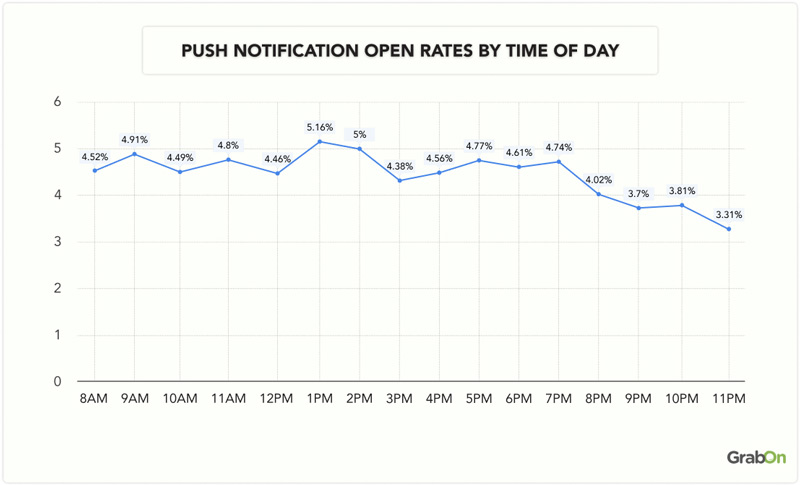
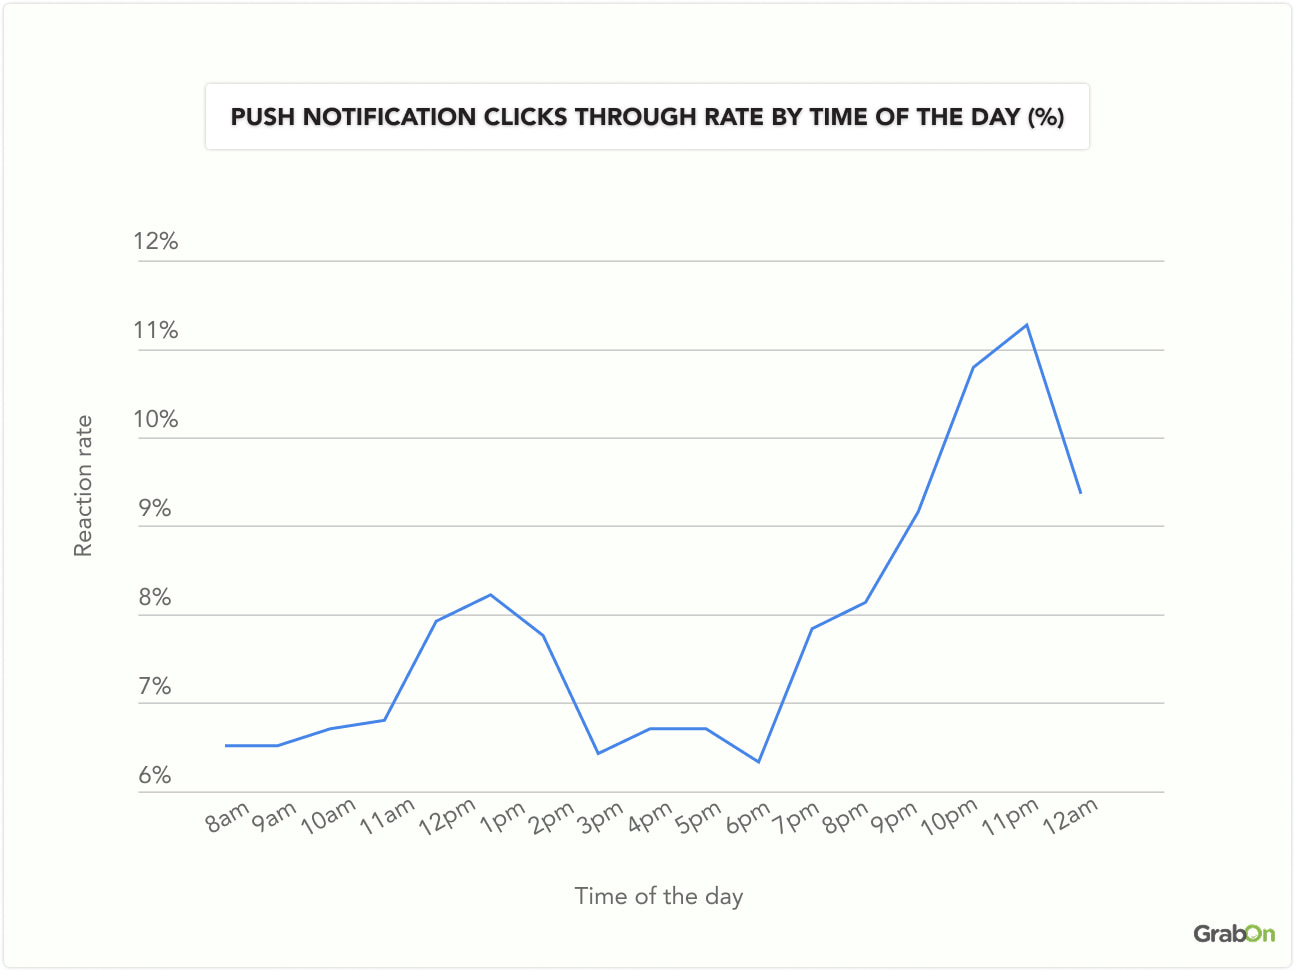
Push notifications receive the highest engagement at 11 PM, with a click-through rate of approximately 11.4%, showing that users are most responsive late at night. The next peak is at 10 PM, where the rate is around 10.8%, indicating strong engagement in the late evening hours.
In contrast, the lowest engagement occurs at 3 PM and 6 PM, with click-through rates dropping to around 6.2%, suggesting that mid-afternoon and early evening are the least effective times to send notifications.
Source: Batch
Push Notification Click-Through Rate by Time of Day
Push notification click-through rates show clear patterns based on the time of day. Engagement remains steady during the morning and early afternoon, with rates between 6% and 8%. However, a noticeable shift happens in the evening, where engagement begins to rise significantly. The highest response rates are seen between 9 pm and 11 pm, peaking at 11.4% at 11 pm. Even midnight shows strong performance with a 9.4% click-through rate.
Overall, the data highlights that users are more likely to interact with push notifications during the late evening and night hours.
Source: Business of Apps
Push Notification Click-Through Rates by Time of Day
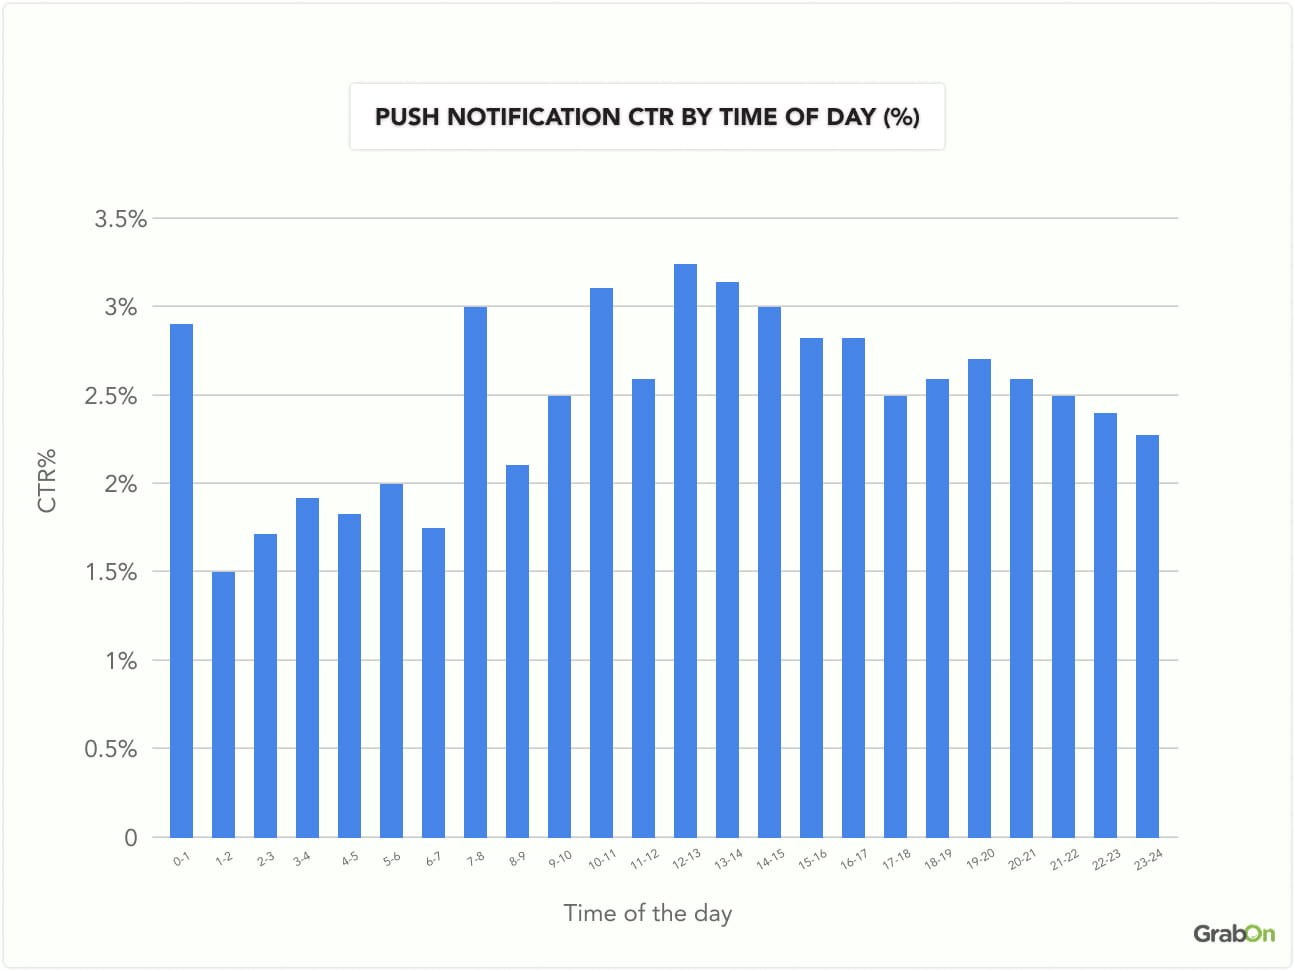
The click-through rate (CTR) for push notifications varies throughout the day. The highest engagement is seen between 12 pm and 2 pm, where CTRs reach up to 3.2%. Another slight increase appears during the morning hours between 10 am and 11 am, with a CTR of 3.1%. In contrast, the lowest engagement happens during the early morning hours (1 am to 6 am), where CTRs drop as low as 1.5% to 2%.
Overall, the data suggests that users are more likely to interact with push notifications around midday and early afternoon.
Source: Business of Apps
Frequency of Notifications Leading Users to Mark Them as Spam
7 out of 10 users and 62% of subscribers consider push notifications as spam when they receive too many. Irrelevant content is another key reason, with 55% of subscribers and 10.2% of users marking such notifications as spam.
Additionally, around 50% of users flag notifications containing invalid or expired offers. And Clickbait headlines cause 55.1% of users to disregard notifications. This shows the importance of balancing frequency, relevance, timing, and transparency to avoid being classified as spam.
Source: Business of Apps
What is the average click through rate (CTR) for Push Notifications
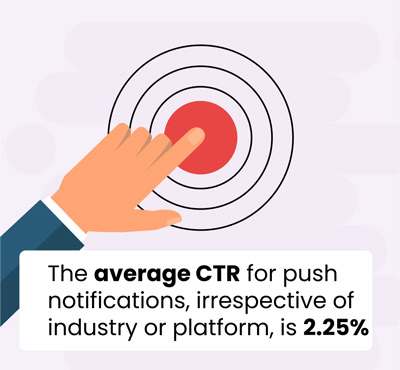
The average click-through rate (CTR) for push notifications, regardless of industry or platform, is 2.25%. This figure represents the proportion of users who click on a push notification after receiving it.
Source: Clevertap
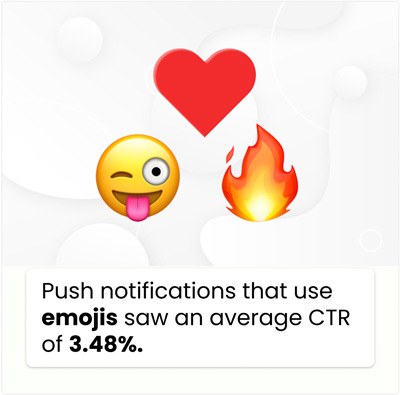
Push notifications that include emojis have an average (CTR) of 3.48%
Push notifications with emojis typically achieve a higher click-through rate (CTR) of 3.48%. Specifically, for mobile apps in the business and finance sectors, using emojis can result in a significant 128% increase in CTR.
Source: Clevertap
Push Notification Opt-In rates for Android and iOS users
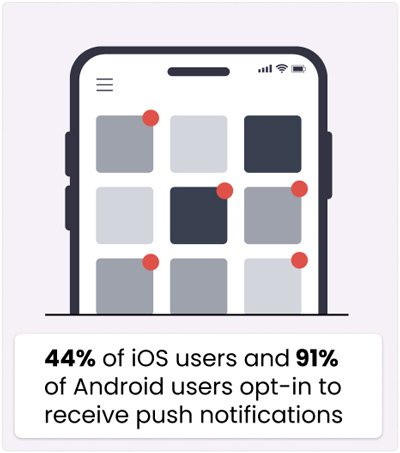
Approximately 40% of iOS users and 90% of Android users choose to receive push notifications. This indicates a significant preference for real-time updates and alerts among Android users, while iOS users show a slightly lower but still notable engagement with push notifications.
Source: Clevertap
What is the Optimal Time to Send Push Notifications
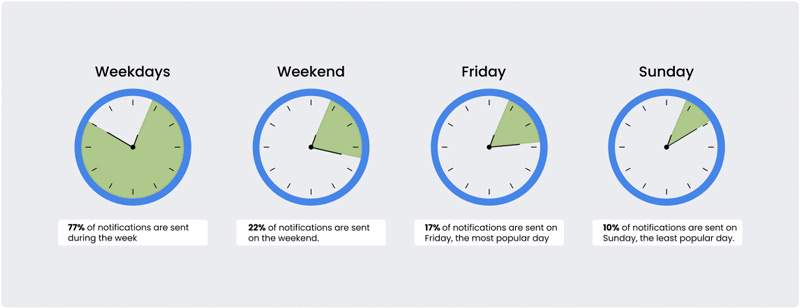
About 77% of push notifications are sent during weekdays, while 22% are sent on weekends. Fridays are the most popular day for notifications, making up 17% of the total, whereas Sundays are the least popular, with only 10% of notifications sent on that day. This shows a clear preference for sending notifications during the workweek and less emphasis on weekends.
Source: Clevertap
What is the Optimal Length for Push Notifications?
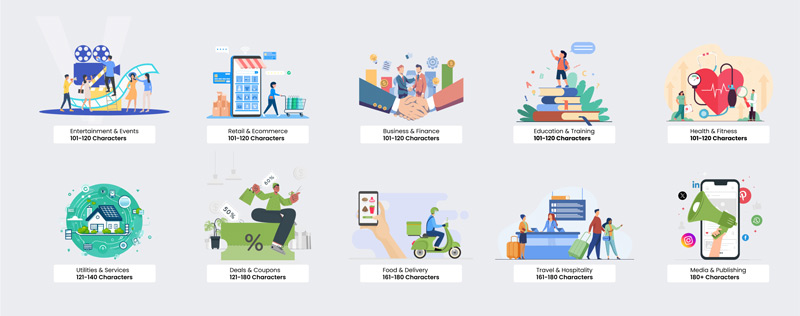
For most industries like Entertainment, Retail, Business, Education, and Health, a concise message of 101-120 characters is ideal. For Utilities and Deals, a slightly longer message of up to 180 characters is more effective.
For industries such as Food, Travel, and Media, even longer notifications are preferred, with Media and Publishing requiring the longest notifications of 180+ characters. So, adjusting your notification lengths according to these guidelines can enhance engagement and effectiveness.
Source: Clevertap
Push Notification Opt-in Rates by Industry for Android Users
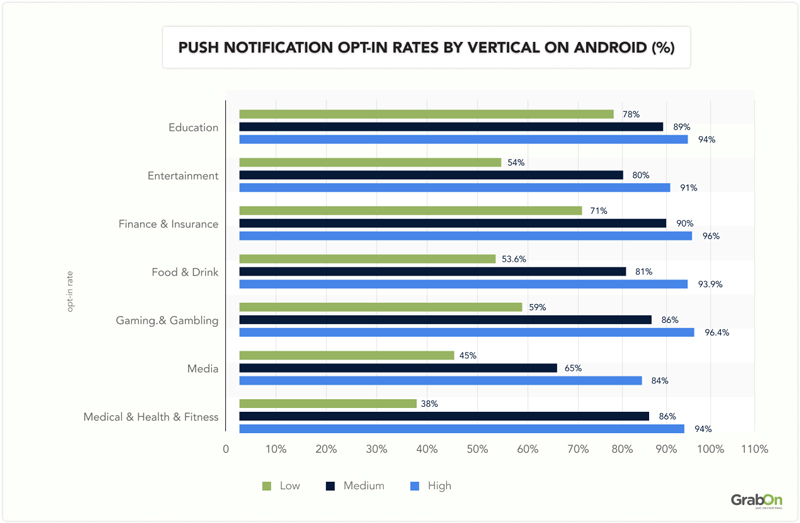
The verticals of Education (89%), Entertainment (94%), Finance and Insurance (96%), and Medical and Health and Fitness (94%) have notably high opt-in rates, indicating a strong willingness among users to receive notifications in these areas.
The Food and Drink (81%) and Gaming and Gambling (86%) verticals have a substantial medium opt-in rate, suggesting a moderate acceptance of notifications.
The Media vertical stands out with the lowest opt-in rates across the categories, with 45% opting in at a low rate. This data indicates that users are more inclined to opt-in for notifications related to essential and frequently used services like finance, health, and education, while media-related notifications have a lower opt-in rate.
Source: Airship, Business of Apps
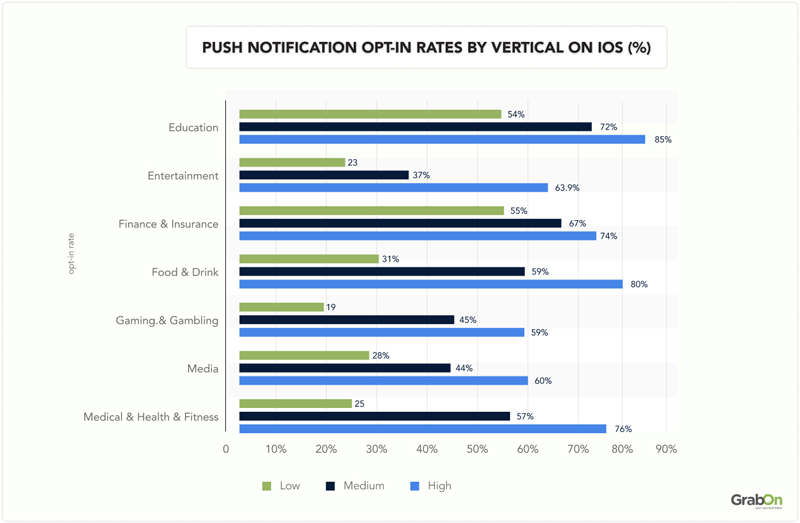
Push Notification Opt-In Rates across Industries For iOS
Verticals such as Education and Food and Drink see the highest opt-in rates, indicating a greater willingness among users to receive notifications in these categories.
The Finance and Insurance, Media, and Gaming and Gambling industries have moderate opt-in rates, with the highest rates being 74%, 60%, and 59% respectively. On the other hand, Entertainment and Gaming and Gambling have the lowest opt-in rates, suggesting a more selective or reluctant user base.
This variability highlights the importance for businesses to tailor their notification strategies based on the specific preferences and behaviors of their target audiences within each vertical.
Source: Airship, Business of Apps
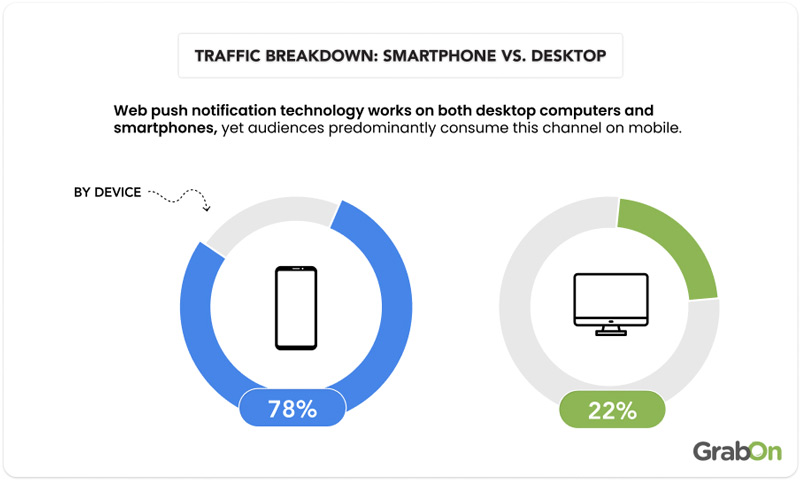
78% of users view push notifications on their smartphones
8 out of 10 users access web push notifications on smartphones, while only 22% do so on desktop computers. This indicates a clear preference for mobile devices over desktops for receiving these notifications.
Source: Batch
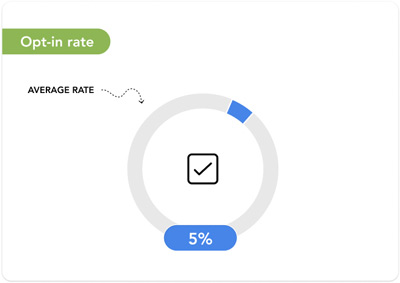
The average opt-in rate for push notifications is 5%
On average, 5% of users opt-in to receive push notifications. This figure represents the percentage of individuals who actively choose to receive these alerts, reflecting the overall engagement level with push notification features.
Source: Batch
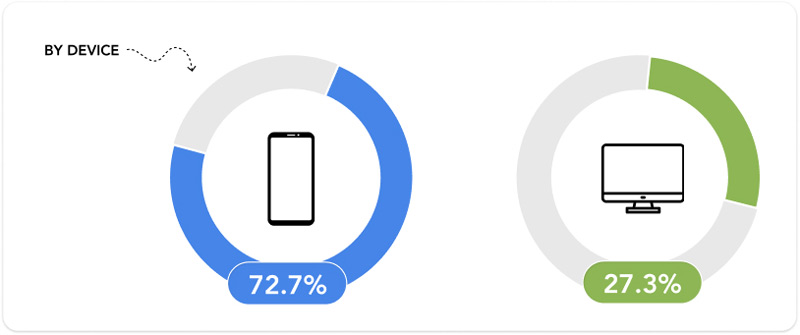
72.7% of users prefer to opt in for push notifications via smartphone.
7 out of 10 users prefer to receive notifications on their mobile phones, compared to just 27.3% who choose to receive them on their laptops. This shows a clear preference for mobile devices for web push notifications.
Source: Batch
How many notifications are considered excessive or spammy?
73% of subscribers and 62% of users consider push notifications to be spammy when they receive too many. Similarly, notifications sent at inconvenient times are also a major concern, with 44.82% of subscribers and 55% of users finding them spammy.
55% of subscribers and 10.2% of users classify notifications as spam if the content is not relevant to them. This highlights the importance of sending timely, relevant, and valuable notifications to avoid being perceived as spam by the recipients.
Source: Business of Apps
Push notifications increase app engagement by 88%
Push notifications can enhance app engagement by 88%. This means that sending push notifications can greatly enhance user interaction and activity within the app, ultimately leading to higher levels of user engagement.
Source: Invespcro
Push notifications can boost app retention rates by 3 to 10 times
Push notifications have the potential to significantly enhance app retention rates, improving them by 3 to 10 times. This means that apps utilizing push notifications effectively can see a dramatic increase in the number of users who continue to use the app over time.
Source: Invespcro
Push Notification Performance Across Different Industries
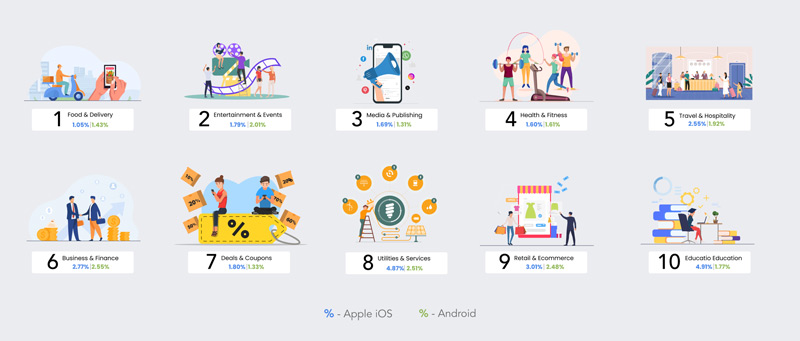
Push notification engagement rates differ across industries for iOS and Android users. In the food and delivery industry, the engagement rate is about 1.05% for iOS and 1.43% for Android. For the travel and hospitality industry, iOS has a 2.55% engagement rate, while Android has 1.92%.
Overall, Overall, the Utilities and Services and Education and Training sectors exhibit the highest engagement rates on iOS, while Entertainment and Events lead on both platforms. Android users generally show higher engagement in sectors like Food and Delivery and Entertainment and Events.

Source: Clevertap
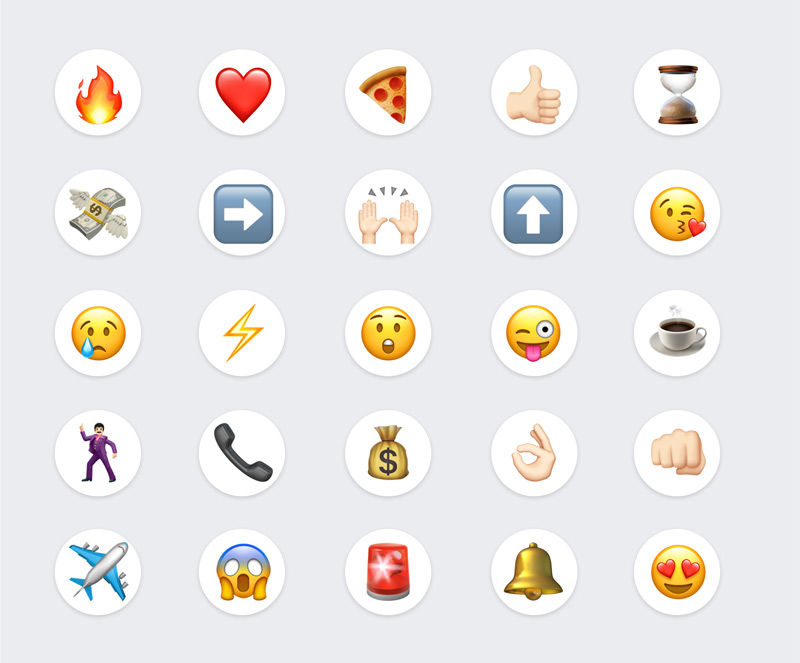
Best Emojis for Increasing Click-Through Rates in Push Notifications
Here are the top 25 emojis to use in push notifications to improve click-through rates (CTRs). These emojis help enhance user engagement and make it more likely that recipients will interact with your notifications.
Source: Clevertap
Powerful Words to Use for a Successful Push Notification Campaign
Here are 15 powerful words to include in your push notifications for a successful campaign.
- Apply
- Discount
- Today
- Ending
- Purchase
- Valid
- Don't Miss
- First
- Hurry
- Offers
- Promo
- Price
- Favorite
- Get Free
- Special
Using these words will make your messages more compelling and engaging, leading to better user responses and improved campaign results.
Source: Clevertap
