State Of US Shopping Malls In 2024

Back in the 70s, approximately 37,000 malls across America grew into centers with food courts, movie theaters, and even ice-skating rinks. However, due to online shopping trends, malls have taken a hit and only around 1,150 malls are left in the country.
This mall crisis took another hit during the Covid-19 lockdown. Despite various challenges, the remaining malls are making a comeback. High-end malls have experienced a 12% increase in visitors since the pandemic, while regular malls have seen a 10% increase.
Let's look at the state of malls in the US through numbers. We will shed light on the decline in the number of malls over the years and how the ones that remain now are doing to tackle the issue of closing malls due to less footfall.
US Shopping Mall Statistics and Trends 2024 (Top Picks)
- There are around 1,150 shopping malls in the US as of 2024.
- Nearly 4 out of 10 Americans no longer visit shopping malls.
- Around 40% of US malls had a 10% vacancy rate even before COVID-19.
- Foot traffic has increased by 12% in top-tier malls and 10% in lower-tier malls post-pandemic.
- Ala Moana Center in Honolulu, Hawaii, is the busiest shopping mall, attracting around 52 million visitors annually.
How Many Shopping Malls Are There In The US?
There are around 1,150 malls in the US in 2024. Predictions suggest that by 2032, only about 150 malls will still be operating. Mall vacancies have been at their highest since 2007 and increased due to COVID-19 lockdowns. More people are shopping online, and stores are closing down, including big ones that usually draw shoppers to malls.

Mall Traffic Statistics
The slow decline in the number of malls led to higher vacancy rates and lesser footfall. With fewer new malls opening, by 2020, vacancy rates went above 6%. There were fewer shoppers and malls, with over 5,000 stores closing as mall-based retailers went bankrupt.
4 out of 10 Americans no longer visit shopping malls.

Source: Gitnux
While COVID-19 contributed to the mall traffic decline, even before the pandemic, nearly 40% of shopping malls in the US had a 10% vacancy rate, as shown below.

Source: Atlanta Federal Reserve
However, by 2022, more consumers were visiting malls, with 40.3% reporting visits within just two weeks.
Foot traffic increased by 12% in top-tier malls and 10% in lower-tier malls compared to 2019, indicating a significant recovery.

Source: Coresight Research
Trends In Mall Traffic And Visitor Behavior
Mall traffic in March 2024 grew by 9.7% for indoor malls, 10.1% for open-air shopping centers, and 10.7% for outlet malls compared to March 2023.

Source: Placer.ai
Factors That Encourage People To Visit Malls
1 in 4 people who go to indoor malls like to eat at the mall. Additionally, around 20% of indoor mall visitors also shop at other nearby stores.
The presence of diverse shops and services near open-air shopping centers and outlet malls significantly encourages visits, with about 13% of open-air shopping center visitors and 14% of outlet mall visitors engaging with these offerings.

Source: Placer.ai
Average Monthly Rent For US Shopping Malls
In the western states, the average rent for malls in the U.S. has reached $26.84 per square foot. Between 2020 and 2024, the average monthly rent for shopping centers in the United States increased by approximately 17.89%. This trend was seen across all regions, with the West having the highest rents at $29 per square foot in the first quarter of 2024.
The table below shows the rising trend in average monthly rents for shopping centers across U.S. regions from 2020 to 2024 –
| Year | United States | Northeast | Midwest | South | West |
| 2020 | $20.34 | $21.48 | $16.11 | $19.79 | $24.01 |
| 2021 | $21.13 | $22.35 | $16.4 | $19.82 | $25.22 |
| 2022 | $22.13 | $22.69 | $17.16 | $21.48 | $26.84 |
| 2023 | $23.16 | $23.18 | $17.82 | $22.69 | $28.11 |
| 2024* | $23.98 | $24.21 | $18.26 | $23.3 | $29.01 |
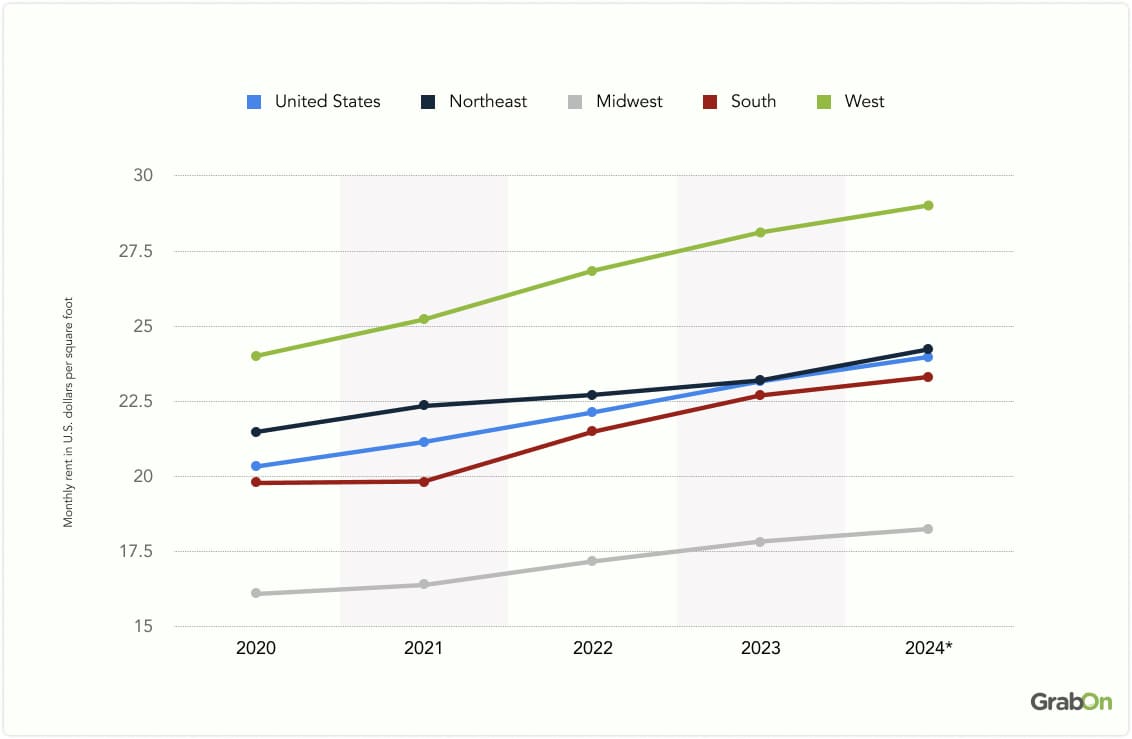
Source: Statista
In 2024, the average monthly rent for shopping centers in top U.S. markets ranged from $13 to $48 per square foot. In the first quarter, Hawaii had the highest rent at $48.03 per square foot. Overall, the West region had the highest rents.

Source: Statista
Which Is The Biggest Mall In The USA?
The Mall of America is the largest mall in the United States, covering 5.6 million square feet and featuring over 520 retail stores. The American Dream Mall is also notable, with 3 million square feet of Gross Leasable Area (GLA) and over 450 retail stores.
Here is a table showing the biggest malls in the US:
| Mall Name | Location | Size (sq ft) | Retail Stores |
| Mall of America | Minnesota | 5.6 million | 520+ |
| American Dream | New Jersey | 3 million | 450+ |
| King of Prussia Mall | Pennsylvania | 2.793 million | 450 |
| Aventura Mall | Florida | 2.7 million | 300+ |
| South Coast Plaza | California | 2.8 million | 270 |
Source: Wikipedia
Largest Gross Leasable Area in US Malls
When it comes to the Gross Leasable Area (GLA), the American Dream Mall in New Jersey is the largest mall in the United States, boasting 3 million square feet. Managed by the Triple Five Group, it exceeds the Mall of America, which, despite its larger total area of 5.6 million square feet, has a retail space of 2.87 million square feet.
The below table features leading shopping malls in the US as of December 2023, ranked by Gross Leasable Area –
| Mall | Gross Leasable Area (GLA) in million square feet |
| American Dream (East Rutherford, NJ) | 3.00 |
| Mall of America (Bloomington, MN) | 2.87 |
| South Coast Plaza (Costa Mesa, CA) | 2.80 |
| King of Prussia Mall (King of Prussia, PA) | 2.67 |
| Del Amo Fashion Center (Torrance, CA) | 2.51 |
| Destiny USA (Syracuse, NY) | 2.40 |
| Roosevelt Field (Garden City, NY) | 2.35 |
| Ala Moana Center (Honolulu, Hawaii) | 2.27 |
| Millcreek Mall (Erie, PA) | 2.20 |
| Palisades Center (West Nyack, NY) | 2.20 |
| Woodfield Mall (Schaumburg, IL) | 2.15 |
| Aventura Mall (Miami Beach, FL) | 2.13 |
| The Galleria (Houston, TX) | 2.01 |
Source: Statista
Which Are the Busiest Malls in America?
In 2019, the Ala Moana Center in Honolulu, Hawaii, was the busiest shopping mall in the United States, attracting around 52 million visitors annually. It was closely followed by the Mall of America in Bloomington, Minnesota, which recorded approximately 40 million visitors during the same year.
Check out the annual footfall rankings of leading US malls in the table below –
| Mall, city, state | Annual footfall |
| Ala Moana Center, Honolulu, HI | 52 million |
| Mall of America, Bloomington, MN | 40 million |
| Houston Galleria, Houston, TX | 31 million |
| Aventura Mall, Miami, FL | 28 million |
| Del Amo Fashion Center, Torrance, CA | 27.6 million |
| Woodfield Mall, Schaumburg, IL | 27 million |
| Sawgrass Mills, Sunrise, FL | 26 million |
| Palisades Center, West Nyack, NY | 24 million |
| Gurnee Mills, Gurnee, IL | 23 million |
| King of Prussia Mall, King of Prussia, PA | 22 million |
Source: Statista
Which Malls in America Have the Most Stores?
The Mall of America in Bloomington leads with over 520 stores, offering extensive shopping and entertainment options. In East Rutherford, the American Dream has 450+ stores, making it a top destination for shopping and leisure.
Some of the busiest malls in America with the highest number of stores are listed below –
| Mall Name | Number of Stores | City/Area |
| Mall of America | 520+ | Bloomington, Minnesota |
| American Dream | 450+ | East Rutherford, New Jersey |
| King of Prussia Mall | 450+ | King of Prussia, Pennsylvania |
| Aventura Mall | 300+ | Aventura, Florida |
| South Coast Plaza | 270+ | Costa Mesa, California |
Source: Wikipedia
US Shopping Mall Vacancy Rates
The number of malls dropped by 16.7% each year from 2017 to 2022. It is estimated that up to 87% of large shopping malls might close in the next 10 years. In 2021, high-end shopping malls had an average vacancy rate of 11.4%, which improved to 8.6% by the end of 2023.
However, the nationwide mall vacancy rate is 110% higher than the average retail vacancy rate.

Source: CapitalOne Shopping
Vacancy Rate Improvements In Shopping Malls
From early 2021 to early 2024, shopping centers successfully reduced their vacancy rates from 7.3% to a predicted 5.4%. This shows how malls have adapted to new market demands and maintained high occupancy levels.
Check out the below table to see how vacancy rates in shopping centers have changed from early 2021 to early 2024 –
| Year | Vacancy Rate (%) |
| Q1 2021 | 7.3 |
| Q2 2021 | 7.1 |
| Q3 2021 | 6.8 |
| Q4 2021 | 6.5 |
| Q1 2022 | 6.2 |
| Q2 2022 | 6.0 |
| Q3 2022 | 5.8 |
| Q4 2022 | 5.6 |
| Q1 2023 | 5.6 |
| Q2 2023 | 5.4 |
| Q3 2023 | 5.4 |
| Q4 2023 | 5.3 |
| Q1 2024* | 5.4 |
Source: Statista
Mall Space Demolition Trends
From 2021 to 2022, the highest mall space demolitions occurred in Q1 2021 at 1.3 million square feet and in Q4 2022 at 1.2 million square feet, indicating significant periodic transformations in mall spaces. However, 2023 saw a decrease in net retail mall occupancy by 406 thousand square feet.

Source: CapitalOne Shopping
Occupancy Rate Of American Malls
By the end of 2022, malls were occupied at 95.1%, up from about 92% in 2020. Deborah Weinswig, founder and CEO of Coresight Research, noted that occupancy above 92% means the mall is fully used, leaving room for new tenants and ensuring a steady flow of changes, which helps malls operate effectively.

Source: Coresight Research
Mall Visitor Trends and Market Impact Post-Pandemic
In 2022, top-tier malls had 11% more long-distance visitors, showing a strong recovery and renewed interest from visitors. Less popular malls also saw a 7% increase in local visitors, stressing their dependence on regional visitors for recovery.
Check out how local and long-distance visitor trends to malls have changed compared to pre-pandemic 2019 levels in the table below –
| Category | 2020 | 2021 | 2022 |
| Local Visitors | |||
| Top-Tier Malls | -26% | -5% | 8% |
| Non-Top-Tier Malls | -20% | 1% | 7% |
| Long-Distance Visitors | |||
| Top-Tier Malls | -33% | -6% | 11% |
| Non-Top-Tier Malls | -26% | 0% | 8% |
Source: Coresight Research
Modernizing Mall Development
In an analysis of 135 mall development projects, 53% included housing, and 34% included office spaces.
Over 50% of shopping malls are expected to add non-retail anchors, such as fitness centers, office spaces, or residential units, by 2025.
By 2030, it is expected that 45% of shopping malls will incorporate mixed-use development.
Source: Passby
E-Commerce Growth Among Retail Brands
In 2024, several brands experienced a shift from mall shopping to online platforms, driven by the rise of e-commerce. Listed below are a few of them:
- Approximately 30% of Macy’s overall sales have transitioned online, reflecting the company’s strategic pivot towards digital growth.
- Nike reports that 26% of its sales are now generated through online channels, emphasizing a strong direct-to-consumer (DTC) approach.
- Gap Inc., including brands like Old Navy, Banana Republic, and Athleta, has seen a substantial 35% shift towards online shopping across its portfolio.
- Sephora, too, has adapted to this trend, with 25% of its sales moving from physical mall stores to its online platform.
- Lastly, JCPenney has observed a 28% increase in online sales, highlighting the growing preference for e-commerce among its customers.
Source: Digital Web Solutions, Red Stag Fulfillment
Shopping Malls In The Age Of E-Commerce
US shopping malls are facing challenges from online shopping, leading to closures, with estimates suggesting up to 25% could shut down by 2025 and vacancy rates hitting a high of 10.5% in 2020. However, top-tier malls are bouncing back, with occupancy rates reaching about 95% and an average 12% increase in foot traffic.
Malls are adapting by adding restaurants and entertainment options, transforming into lively destinations beyond just shopping. Despite the rise of e-commerce, malls still play a significant role, capturing 12.9% of US consumer spending in 2023, showing their ongoing importance and potential for recovery.