41 Digital Wallet Statistics: Users, Market Size & Growth
Digital wallets or e-wallets are transforming how we manage money. In 2024, over 4.4 billion people, nearly 54% of the global population, are using them, and the market is projected to reach $25 trillion by 2027. Popular in regions like Asia, North America, and Europe, digital wallets are becoming essential for both online and in-store payments.
Digital wallets are not just for tech-savvy users. They also connect underbanked communities with services like peer-to-peer payments, Buy Now, Pay Later, and lending. This blog dives into the latest digital wallet statistics, exploring global growth trends and how they're shaping the future of payments.
Digital Wallet Statistics 2024 (Editor's Picks)
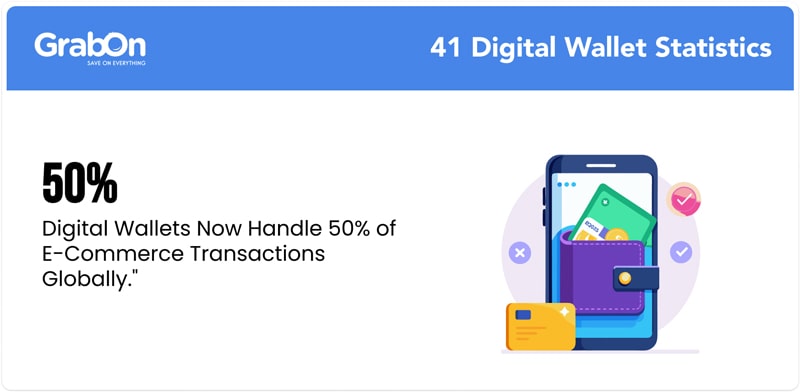
- Digital wallets make up 50% of e-commerce purchases and 30% of in-store purchases worldwide, accounting for $14 trillion in transaction value.
- China and India lead as digital wallets overtake cash and cards in Asia.
- About 53% of Americans use digital wallets more than traditional payment methods.
- The most popular digital wallets in the U.S. are PayPal (36%), Apple Pay (20%), and Venmo (16%).
- 47% of consumers in the U.S. tend to spend more money when using digital wallets.
- Millennials and Gen Z are the primary drivers, with more than 82% of them consistently using digital wallets.
Digital Wallet Global User Statistics
1. The growth of digital wallet users worldwide is remarkable. In 2024, over 4.4 billion people are using digital wallets, representing approximately a 12% increase compared to 2023.
2. 65% of adults in the U.S. reported using a digital wallet at least once in the past month.
3. This growth is also particularly strong in regions like Asia-Pacific, where nearly 70% of online payments and 50% of in-store payments use digital wallets.
4. In 2023, China led the world in digital wallet usage, with 82% of e-commerce spending and 66% of physical purchases made through digital wallets, amounting to approximately $7.6 trillion in transactions.
5. India, the most populous country with the largest youth population, is not far behind. Over 50% of consumers used digital wallets for both online and in-store purchases last year, with the Unified Payments Interface (UPI) being one of the most popular transaction platforms.
6. In comparison, digital wallet spending in Europe accounted for just 30% of e-commerce transactions and 13% of physical spending.
7. In the U.S., digital wallet usage makes up 37% of online sales and 42% of physical payments.
8. Demographic insights reveal that digital wallets are most popular among Millennials and Gen Z, with nearly 70% of the users under the age of 40.
Global Digital Wallet Market Size and Growth Statistics
9. The global digital wallet market is currently valued at approximately $13.79 billion, with digital wallets accounting for 50% of e-commerce transactions and 30% of point-of-sale (POS) consumer spending.
10. The digital wallet market size is expected to reach $45.17 billion by 2029, growing at a CAGR of 26.78% during the projected period 2024-2029.
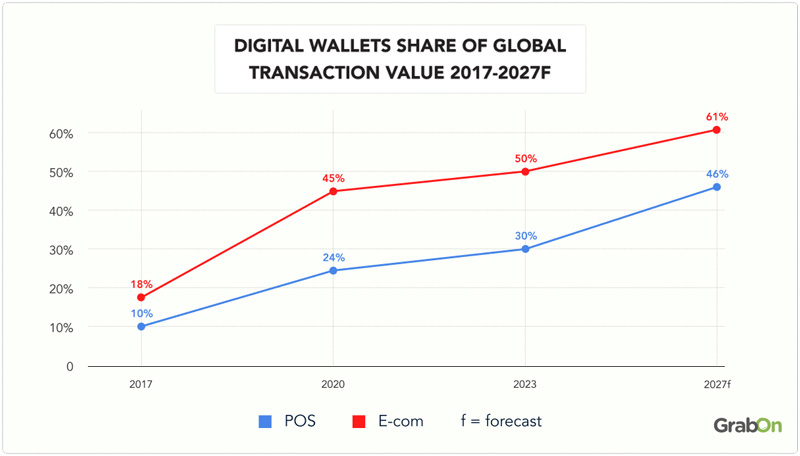
11. In 2024, digital wallets account for $14 trillion in transaction value. This growth trajectory is expected to continue, with projections indicating that by 2027, digital wallets will account for $25 trillion in global transaction value.
Digital Wallet Growth by Region
12. North America: In North America, digital wallets have gained significant traction, making up 37% of POS transactions, closely followed by credit cards at 34%. The top digital wallets in the U.S. include PayPal (36%), Apple Pay (20%), and Venmo (16%).
13. Asia-Pacific: Asia-Pacific is leading in digital wallet adoption, with countries like China and India showing remarkable growth. India, for instance, sees more than half of its POS and e-commerce transactions funded by digital wallets, often linked to instant payment systems.
14. Europe: In Europe, the Netherlands stands out, with 64% of e-commerce transactions being processed through account-to-account (A2A) transfers, a method frequently used in digital wallets.
15. In developing regions like Asia, Africa, the Middle East, and Latin America, mobile wallets have become a major tool for helping people access financial services where banks are hard to reach.
Asia-Pacific is growing the fastest in mobile wallet use, followed by Africa and the Middle East.
Here's a table showing global digital wallet adoption by region:
| Region | % of the Population Using Digital Wallets | % of E-Commerce Transactions | % of In-Store Transactions |
| Asia-Pacific | 65% | 70% | 50% |
| North America | 55% | 37% | 42% |
| Europe | 45% | 30% | 13% |
| Latin America | 35% | 35% | 20% |
| Africa and Middle East | 25% | 20% | 15% |
Digital Wallet Demographic Statistics
16. The demographic breakdown of digital wallet users reveals some intriguing patterns:
- Age: Millennials and Gen Z are particularly comfortable with online transactions, from purchasing products and paying bills to managing their finances and conducting online banking activities.
About 80% of Gen Z use digital wallets for most of their transactions, compared to about 66% of Millennials.
Additionally, approximately 43.7% of Gen X and 25.7% of Baby Boomers also use digital wallets for their transactions.
Here's a table showing digital wallet usage by age group in 2024:
| Age Group | % of Digital Wallet Users | Primary Use | % Reporting Overspending |
| Gen Z (born between 1997 and 2012) | 80% | Online shopping, bill payments | 60% |
| Millennials (born between 1981 and 1996) | 66% | Online shopping, peer-to-peer payments | 51% |
| Gen X (born between 1965 and 1980) | 43.7% | Managing finances, bill payments | 41% |
| Baby Boomers (born between 1946 and 1964) | 25.7% | Paying bills, occasional online purchases | 28% |
- Income Level: High-income earners (>$100,000 annually) are the most frequent users, with 58% utilizing digital wallets for daily transactions, compared to 45% of middle-income earners ($50,000 – $100,000)
- Gender: Digital wallets are more popular among men, with 54% of male respondents using them regularly, compared to 46% of women
Consumer Behavior and Spending Patterns
17. Digital wallets are not only a convenient payment method but also influence consumer spending habits. 53% of Americans use digital wallets more often than traditional payment methods.
18. 47% of U.S. consumers report spending more when using digital wallets compared to traditional payment methods.
19. Consumers who use digital wallets tend to spend 31% more across various categories than those who don’t.
20. 67% of users sometimes lose track of their spending when using digital wallets.
21. Younger generations are more prone to overspending with digital wallets. Over 60% of Gen Z and 51% of Millennials report spending more this way, compared to 41% of Gen X and 28% of Baby Boomers.
22. High earners tend to spend more with digital wallets. 61% of those making over $150,000 reported increased spending due to digital wallets, compared to 30% of those earning under $30,000. Middle-income earners ($60,001 to $90,000) also show a trend, with 44% spending more.
| Household Income | % Spending More with Digital Wallets |
| Over $150,000 | 61% |
| $60,001 – $90,000 | 44% |
| Under $30,000 | 30% |
23. About 35% of digital wallet users in the U.S. participate in loyalty programs offered through their wallets, leading to increased spending and brand loyalty.
24. 15% of digital wallet users regularly leave their house without carrying a physical wallet.
25. 77% of U.S. consumers who used a digital wallet in the past year are highly satisfied.
26. 51% of people say they would stop shopping with a merchant that doesn't offer digital wallet payments.
27. Trends show that digital wallets are most commonly used for purchases in these categories:
| Category | % of Purchases via Digital Wallets |
| Drugstore and Pharmacies | 53% |
| Department Stores | 50% |
| Online Shopping | 50% |
| Events | 49% |
| Restaurants and Bars | 47% |
28. The top 3 reasons why people use digital wallets include convenience (41%), followed by the availability of rewards and loyalty programs (23%), and the ability to track recent purchases (16%).
| Reason | % of Users |
| Convenience | 41% |
| Availability of rewards or loyalty programs | 23% |
| Ability to track recent purchases | 16% |
| Enhanced security | 14% |
| Faster checkout process | 4% |
| Nothing in particular | 3% |
Leading Digital Wallet Providers Stats
29. In 2024, PayPal, Apple Pay, and Google Pay remain the top digital wallet providers globally, collectively holding over 65% of the market share.
30. PayPal leads the pack in the U.S. with a 36% share in terms of adoption, thanks to its extensive global reach and integration with various e-commerce platforms. Globally, PayPal processes $1.25 trillion in transactions annually.
31. Despite PayPal's wide usage, Apple Pay is popular with younger customers, such as Millennials and Gen Z. It holds a 92% share of mobile wallet transactions.
32. Emerging players like Samsung Pay and Amazon Pay are gaining traction, particularly in Asia and Latin America, where their user bases are expanding rapidly.
33. China's payment market is overwhelmingly led by two ubiquitous payment brands: the digital wallets Alipay and WeChat Pay. Together, these platforms accounted for around 90% of the country’s $7.5 trillion in digital wallet transactions in 2023.
34. India's digital wallet market is led by three key players: Google Pay, Paytm, and PhonePe, which together account for about 95% of all UPI transactions.
35. In 2024, Google Pay dominated Indian mobile payments, used by 82% of consumers in-store and 80% online, surpassing its penetration in other countries.
Digital Wallet Usage Trends Statistics
36. Contactless payments via digital wallets continue to rise, with 60% of consumers using mobile wallets for their transactions. This trend is particularly strong in urban areas where consumers value speed and convenience.
37. In the U.S., consumer use of tap-to-pay options has surged in recent years, nearing an estimated $300 billion in transactions across Apple Pay, Samsung Pay, and Google Pay.
38. The integration of BNPL (Buy Now, Pay Later) services within digital wallets is booming. In 2024, 25% of digital wallet users have used BNPL services.
39. In the U.S., BNPL spending increased by 23% in 2023 compared to the previous year. Cyber Monday 2023 set a record for BNPL transactions, surpassing $940 million in online sales. BNPL made up about 5% of online spending in 2023, with projections for an annual growth rate of 10% through 2027.
40. Mobile-first transactions have overtaken desktops in many regions. In 2024, about 68% of digital wallet transactions were made via smartphones, reflecting a shift towards convenience and on-the-go payments.
41. Biometric authentication is becoming more common in digital payments, with the market expected to reach $3 trillion by 2025. Technologies like fingerprint, facial, and voice recognition are key to secure and convenient transactions. Users can now use their unique biological features to access their digital wallets, eliminating the need to remember passwords.
Wrapping Up
Digital wallets are taking over the world of payments, with 4.4 billion users in 2024. They now handle 50% of e-commerce and 30% of in-store transactions globally, changing how we manage money. Popular among Millennials and Gen Z, they're also opening doors for underbanked communities.
As mobile-first transactions and biometric authentication rise, digital wallets are set to shape the future of payments, with the market projected to hit $25 trillion by 2027. Expect even more convenience and security as this space evolves.