Roblox Usage Statistics: How Many People Play Roblox (2025)
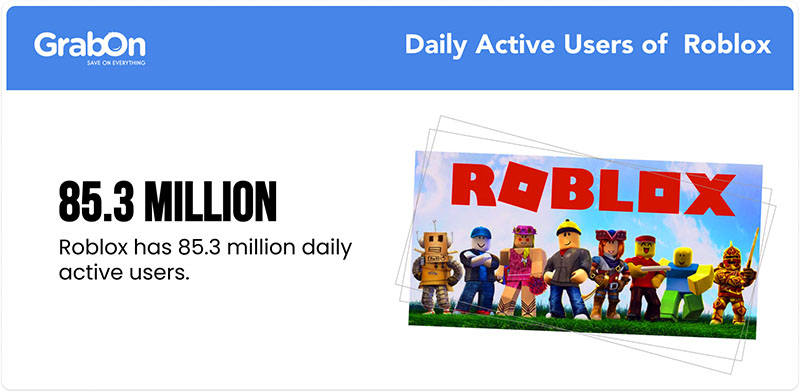
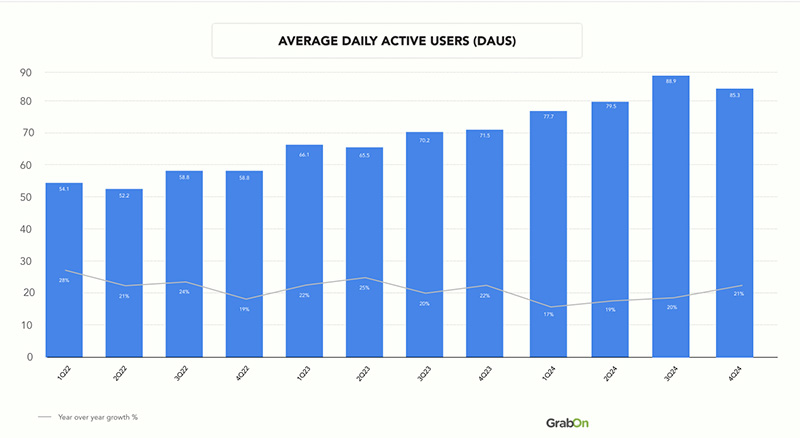
Roblox is an online platform where millions of people come together to create, share, and explore 3D worlds. As of Q4 2024, it boasts over 85.3 million daily active users, making it one of the most-played games of the year.
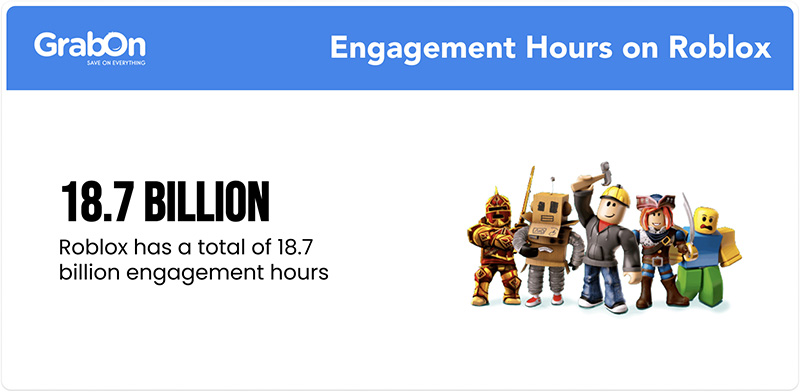
In 2024, Roblox users spent a staggering 73.5 billion hours on the platform. With 380 million monthly active users contributing 18.7 billion engagement hours, the platform features 6 million active experiences created by more than 2.8 million developers.
In this blog, we will explore key statistics about Roblox’s growth, user demographics, and how people engage with the platform. This will provide a clear picture of Roblox’s impact and role in online entertainment.
Roblox Statistics 2025 (Editor’s Picks)
- Roblox has more than 85.3 million daily active users around the globe.
- Roblox currently features approximately 6 million games on its platform.
- It is estimated that there are 380 million players or subscribers on Roblox in total
- Roblox currently has more than 2.8 million developers.
- 80% of Roblox users prefer to access the game on mobile devices.
- The average booking per monthly unique payer on Roblox is $19.34.
- As of Q4 2024, Roblox has accumulated a total of 18.7 billion engagement hours.
Roblox daily active users
In 2024 Q4, Roblox had 85.3 million daily active users, a drop of 3.6 million users from 2024 Q3, when the platform had 88.9 million users. While this shows a small dip, the overall trend over the years has been very positive, with a strong increase in daily users since 2020.
Here is the table showing the total daily active users on Roblox
| 2020 (Q1) | 23.6 Million |
| 2020 (Q2) | 33.4 Million |
| 2020 (Q3) | 36.2 Million |
| 2020 (Q4) | 37.1 Million |
| 2021 (Q1) | 42.1 Million |
| 2021 (Q2) | 43.2 Million |
| 2021 (Q3) | 47.3 Million |
| 2021 (Q4) | 49.5 Million |
| 2022 (Q1) | 54.1 Million |
| 2022 (Q2) | 52.2 Million |
| 2022 (Q3) | 58.8 Million |
| 2022 (Q4) | 58.8 Million |
| 2023 (Q1) | 66.1 Million |
| 2023 (Q2) | 65.5 Million |
| 2023 (Q3) | 70.2 Million |
| 2023 (Q4) | 71.5 Million |
| 2024 (Q1) | 77.7 Million |
| 2024 (Q2) | 79.5 Million |
| 2024 (Q3) | 88.9 Million |
| 2024 (Q4) | 85.3 Million |

User Engagement Hours On Roblox Games
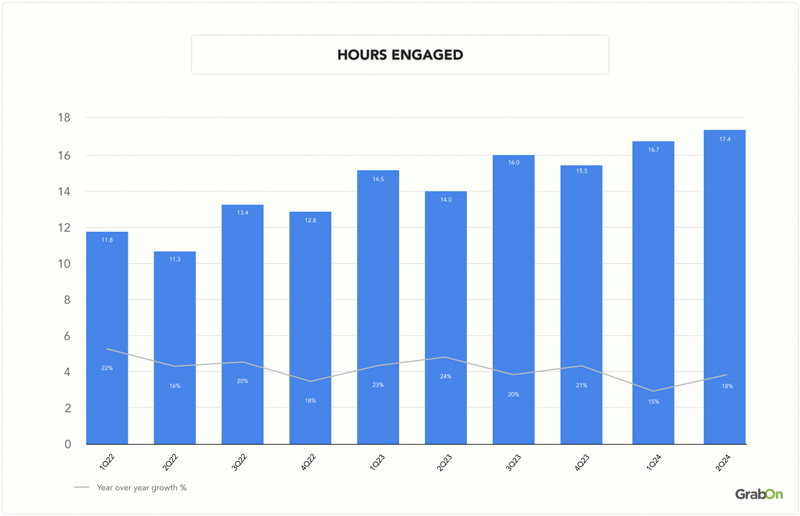
In 2024 Q4, Roblox recorded 18.7 billion engagement hours. While this is a very high number, it’s actually a drop compared to 2024 Q3, when engagement hours reached an all-time high of 20.7 billion. This means there was a decrease of 2 billion engagement hours between the two quarters. Despite this small dip, Roblox's overall engagement in 2024 remained strong and much higher than in previous years.
Here is the table showing the total engagement hours on Roblox
| Year | Engagement Hours on Roblox |
| 2020 (Q1) | 4.88 Billion |
| 2020 (Q2) | 8.59 Billion |
| 2020 (Q3) | 8.71 Billion |
| 2020 (Q4) | 8.43 Billion |
| 2021 (Q1) | 9.67 Billion |
| 2021 (Q2) | 9.74 Billion |
| 2021 (Q3) | 11.18 Billion |
| 2021 (Q4) | 10.82 Billion |
| 2022 (Q1) | 11.82 Billion |
| 2022 (Q2) | 11.29 Billion |
| 2022 (Q3) | 13.4 Billion |
| 2022 (Q4) | 12.81 Billion |
| 2023 (Q1) | 14.49 Billion |
| 2023 (Q2) | 13.99 Billion |
| 2023 (Q3) | 16.04 Billion |
| 2023 (Q4) | 15.5 Billion |
| 2024 (Q1) | 16.7 Billion |
| 2024 (Q2) | 17.4 Billion |
| 2024 (Q3) | 20.7 Billion |
| 2024 (Q4) | 18.7 Billion |
Source: Roblox, Statista, Roblox Share Holder Letter
Roblox active users by age Group
In 2024 Q4, Roblox had 32.5 million daily active users under the age of 13 and 52.1 million daily active users over the age of 13. Compared to 2024 Q3, when there were 34.5 million users under 13 and 53.6 million users over 13, there was a decrease of 2 million in users under 13 and a drop of 1.5 million in users over 13. The data reflects that Roblox's appeal spans both younger and older age groups.
The table below shows the daily active users on Roblox by age group
| 13 Years and Under | Over 13 Years | |
| 2020 (Q1) | 13.3 Million | 9.7 Million |
| 2020 (Q2) | 17.9 Million | 14.6 Million |
| 2020 (Q3) | 19.3 Million | 16.1 Million |
| 2020 (Q4) | 19.5 Million | 17.2 Million |
| 2021 (Q1) | 21.3 Million | 20.5 Million |
| 2021 (Q2) | 21.5 Million | 21.4 Million |
| 2021 (Q3) | 23.1 Million | 23.8 Million |
| 2021 (Q4) | 23.6 Million | 25.6 Million |
| 2022 (Q1) | 25.5 Million | 28.3 Million |
| 2022 (Q2) | 24.2 Million | 27.7 Million |
| 2022 (Q3) | 26.4 Million | 31.9 Million |
| 2022 (Q4) | 26 Million | 32.4 Million |
| 2023 (Q1) | 28.7 Million | 36.9 Million |
| 2023 (Q2) | 28.2 Million | 36.8 Million |
| 2023 (Q3) | 29.7 Million | 40 Million |
| 2023 (Q4) | 29.3 Million | 41.4 Million |
| 2024 (Q1) | 32.1 Million | 44.9 Million |
| 2024 (Q2) | 32.4 Million | 46.4 Million |
| 2024 (Q3) | 34.5 Million | 53.6 Million |
| 2024 (Q4) | 32.5 Million | 52.1 Million |
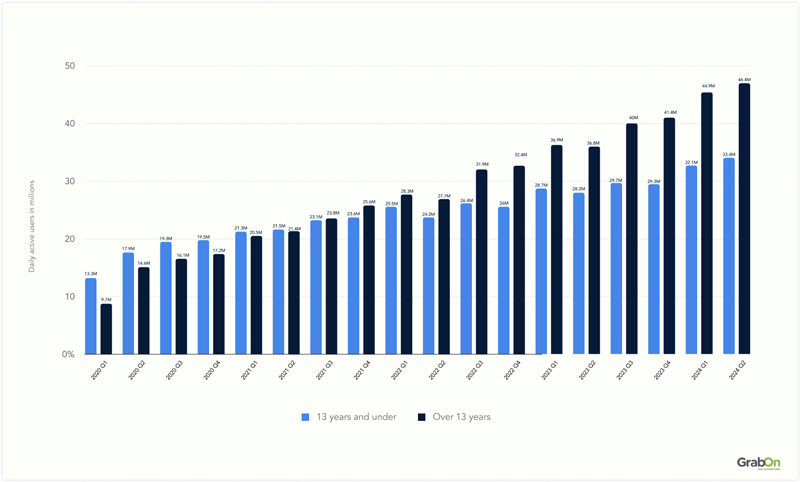
Source: Statista
Most Played Roblox Games
Brookhaven RP is the most popular game on Roblox with an impressive 50.24 billion all-time visits. Next on the list is Adopt Me!, which has garnered 36.7 billion all-time visits with its engaging pet and family simulation gameplay. Blox Fruits follows closely with 36.12 billion visits, attracting players with its action-packed adventures.
Here is the table showing the most played games on Roblox
Brookhaven RP is the most played game on Roblox, with 58.59 billion visits, which shows its popularity among players. Blox Fruits follows closely, with 45.62 billion visits, and Adopt Me! with 38.32 billion. These top three games dominate the platform in terms of user engagement and player time spent. On the other hand, BedWars has the fewest visits on the list, with 9.99 billion.
The data highlights that roleplay games like Brookhaven RP and Adopt Me!, as well as action-packed adventure games like Blox Fruits, are among the most beloved on Roblox, showing a strong preference for immersive and interactive experiences.
Here is the table showing the most played games on Roblox
| Name of the Genre | No. of Visits |
| Brookhaven RP | 58.59 Billion |
| Blox Fruits | 45.62 Billion |
| Adopt Me! | 38.32 Billion |
| Tower of Hell | 24.34 Billion |
| Murder Mystry 2 | 19.06 Billion |
| MeepCity | 16.14 Billion |
| Piggy | 13.24 Billion |
| The Strongest Battlegrounds | 10.29 Billion |
| Royale High | 10.07 Billion |
| BedWars | 9.99 Billion |
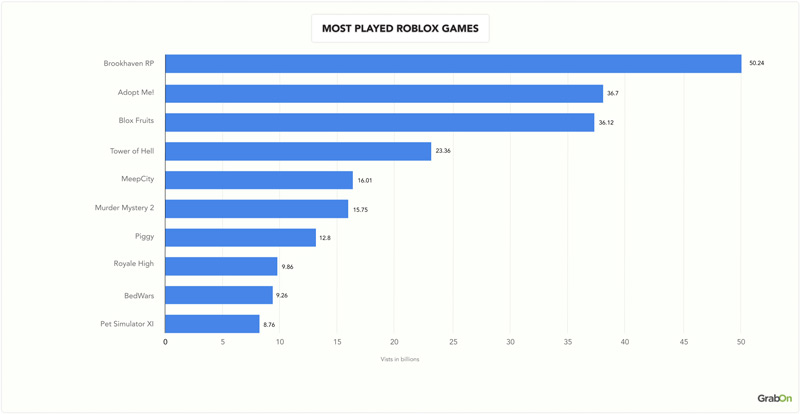
Source: Statista
Total number of Roblox app downloads globally
In the second quarter of 2024, Roblox saw a notable rise in downloads, reaching 54.86 million. This represents an increase of 4.61 million downloads compared to the 50.96 million downloads reported in Q4 2023.
By 2025, the number of Roblox app downloads is expected to reach approximately 59.8 million.
Below is the table showing the total number of Roblox downloads worldwide
In 2024 Q4, Roblox recorded 50.31 million app downloads worldwide. This marks a drop of 9.64 million downloads compared to 2024 Q3, which had 59.95 million downloads. Looking at the overall trend from 2020 to 2024, Roblox has consistently seen high download numbers. The data reveals that Roblox continues to be one of the most downloaded apps globally. While there are some ups and downs each quarter, the general trend over the past five years has been upward.
Below is the table showing the total number of Roblox downloads worldwide
| Year | No. of Roblox App Downloads |
| 2020 (Q1) | 36.2 Million |
| 2020 (Q2) | 40.46 Million |
| 2020 (Q3) | 43.30 Million |
| 2020 (Q4) | 39.44 Million |
| 2021 (Q1) | 38.92 Million |
| 2021 (Q2) | 37.87 Million |
| 2021 (Q3) | 43.18 Million |
| 2021 (Q4) | 47.6 Million |
| 2022 (Q1) | 43.15 Million |
| 2022 (Q2) | 39 Million |
| 2022 (Q3) | 42.93 Million |
| 2022 (Q4) | 41.78 Million |
| 2023 (Q1) | 50.96 Million |
| 2023 (Q2) | 51.44 Million |
| 2023 (Q3) | 51.01 Million |
| 2023 (Q4) | 50.25 Million |
| 2024 (Q1) | 55.85 Million |
| 2024 (Q2) | 54.86 Million |
| 2024 (Q3) | 59.95 Million |
| 2024 (Q4) | 50.31 Million |
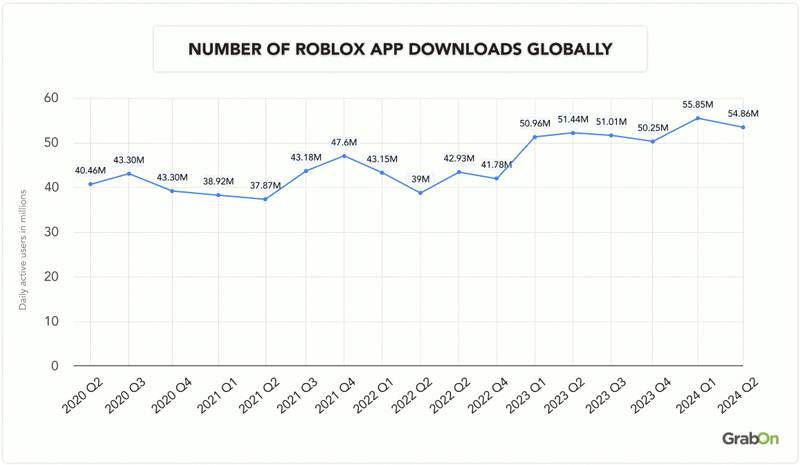
Source: Statista
Daily Active Users on Roblox Games by Region
In Q2 2024, Roblox had 17.1 million users in the US and Canada, 20.6 million in Europe, 20.2 million in Asia-Pacific, and 21.6 million in the Rest of the World. The Asia-Pacific region experienced the highest increase in users, growing by 7.5% from 18.8 million to 20.2 million during this period.
| Year | US and Canada | Europe | Asia-Pacific | Rest of World |
| 2021 (Q1) | 12.6 Million | 12.5 Million | 6.5 Million | 10.6 Million |
| 2021 (Q2) | 12.1 Million | 11.8 Million | 7.2 Million | 12.1 Million |
| 2021 (Q3) | 12.2 Million | 11.9 Million | 9.4 Million | 13.8 Million |
| 2021 (Q4) | 11.2 Million | 13.4 Million | 11.2 Million | 13.7 Million |
| 2022 (Q1) | 12.4 Million | 15 Million | 12.6 Million | 14.2 Million |
| 2022 (Q2) | 12.4 Million | 14.1 Million | 12.3 Million | 13.4 Million |
| 2022 (Q3) | 14.2 Million | 15.5 Million | 13.2 Million | 15.9 Million |
| 2022 (Q4) | 13.3 Million | 16.6 Million | 13.6 Million | 15.3 Million |
| 2023 (Q1) | 14.3 Million | 19 Million | 14.9 Million | 17.9 Million |
| 2023 (Q2) | 14.2 Million | 18.2 Million | 15.5 Million | 17.7 Million |
| 2023 (Q3) | 15.7 Million | 18.9 Million | 16.2 Million | 19.4 Million |
| 2023 (Q4) | 15.6 Million | 20 Million | 17.2 Million | 18.7 Million |
| 2024 (Q1) | 16.2 Million | 21.4 Million | 18.8 Million | 21.3 Million |
| 2024 (Q2) | 17.1 Million | 20.6 Million | 20.2 Million | 21.6 Million |
| 2024 (Q3) | 19.7 Million | 21.7 Million | 22.3 Million | 25.2 Million |
| 2024 (Q4) | 18 Million | 21.1 Million | 22.3 Million | 23.8 Million |
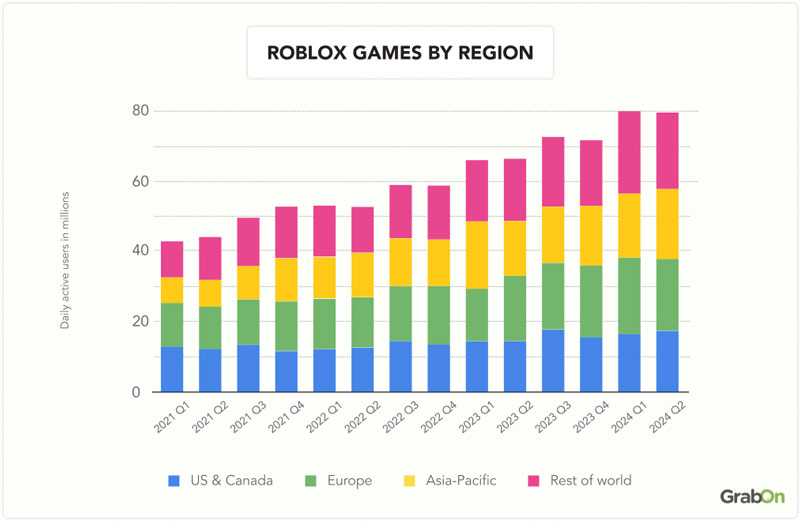
Source: Statista, Roblox Share Holder Letter
Daily Active Users on Roblox Games by Region
In Q2 2024, Roblox had 17.1 million users in the US and Canada, 20.6 million in Europe, 20.2 million in Asia-Pacific, and 21.6 million in the Rest of the World. The Asia-Pacific region experienced the highest increase in users, growing by 7.5% from 18.8 million to 20.2 million during this period.
| Year | US and Canada | Europe | Asia-Pacific | Rest of World |
| 2021 (Q1) | 12.6 Million | 12.5 Million | 6.5 Million | 10.6 Million |
| 2021 (Q2) | 12.1 Million | 11.8 Million | 7.2 Million | 12.1 Million |
| 2021 (Q3) | 12.2 Million | 11.9 Million | 9.4 Million | 13.8 Million |
| 2021 (Q4) | 11.2 Million | 13.4 Million | 11.2 Million | 13.7 Million |
| 2022 (Q1) | 12.4 Million | 15 Million | 12.6 Million | 14.2 Million |
| 2022 (Q2) | 12.4 Million | 14.1 Million | 12.3 Million | 13.4 Million |
| 2022 (Q3) | 14.2 Million | 15.5 Million | 13.2 Million | 15.9 Million |
| 2022 (Q4) | 13.3 Million | 16.6 Million | 13.6 Million | 15.3 Million |
| 2023 (Q1) | 14.3 Million | 19 Million | 14.9 Million | 17.9 Million |
| 2023 (Q2) | 14.2 Million | 18.2 Million | 15.5 Million | 17.7 Million |
| 2023 (Q3) | 15.7 Million | 18.9 Million | 16.2 Million | 19.4 Million |
| 2023 (Q4) | 15.6 Million | 20 Million | 17.2 Million | 18.7 Million |
| 2024 (Q1) | 16.2 Million | 21.4 Million | 18.8 Million | 21.3 Million |
| 2024 (Q2) | 17.1 Million | 20.6 Million | 20.2 Million | 21.6 Million |
| 2024 (Q3) | 19.7 Million | 21.7 Million | 22.3 Million | 25.2 Million |
| 2024 (Q4) | 18 Million | 21.1 Million | 22.3 Million | 23.8 Million |
Source: Statista, Roblox Share Holder Letter
Highest-grossing mobile games worldwide
The table lists the top-grossing mobile games in the world based on their total revenue. Leading the chart is Honor of Kings, bringing in an impressive $1,867.96 million. It’s followed by MONOPOLY GO! with $1,580.77 million and Royal Match with $1,461.45 million. Roblox, known for its player-generated experiences, ranks fourth with $1,189.34 million, highlighting its strong presence in the mobile gaming world.
Here is the table showing top-grossing mobile games by total revenue
| Mobile Games | Total Revenue |
| Honor of Kings | $1,867.96 million |
| MONOPOLY GO! | $1,580,77 Million |
| Royal Match | $1,461.45 Million |
| Roblox | $1,189.34 Million |
| PUBG Mobile | $1,181.02 Million |
| Last War: Survial | $1,147.1 Million |
| Candy Crush Saga | $1,084.29 Million |
| Whiteout Survial | $998.57 Million |
| Dungeon Figther: Origins | $769.71 Million |
| Coin Master | $726.34 Million |
| Brawl Star | $662.07 Million |
| Honkai: Star Rail | $596.2 Million |
| Pokemon GO | $544.68 Million |
| Genshin Impact | $513.55 Million |
| Gardenscape | $503.65 Million |
| Township | $402.72 Million |
| Monster Strike | $392.96 Million |
| Battle of the Golden Shovel | $378.65 Million |
| Growing Mushrooms | $361.22 Million |
| Clash of Clans | $355.57 Million |
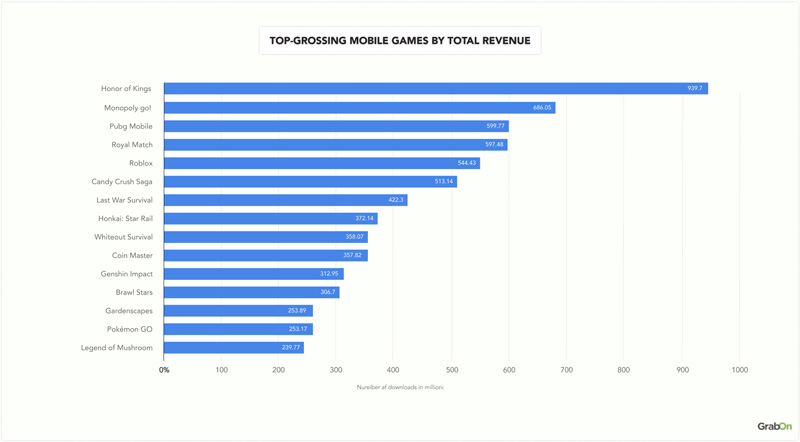
Source: Statista
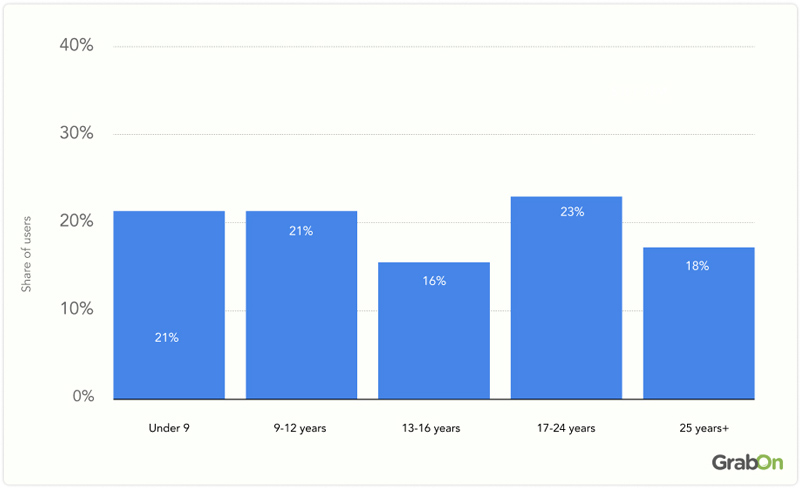
Roblox Audience Breakdown by Age Group
23% of Roblox users are between the ages of 17 and 24, making this the largest demographic group on the platform. Following closely are users under 9 and those aged 9-12, accounting for 21% of its user base. 16% of Roblox users fall in the 13-16 age group, making it the smallest age bracket. This indicates that the platform is more popular among Gen Z and Millennials.
Here is the table that presents the age breakdown among Roblox users
| Age Group | % of Roblox Users |
| Under 9 | 21% |
| 9-12 Years | 21% |
| 13-16 Years | 16% |
| 17-24 Years | 23% |
| 25 Years + | 18% |
Source: Statista, Roblox Share Holder Letter
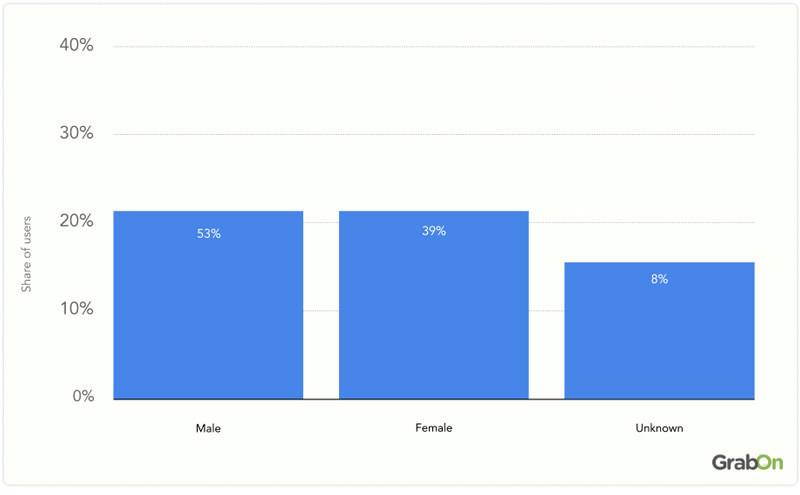
Roblox users by Gender
5 out of 10 Roblox users are male, making it the largest gender group on the platform. Females account for 39% of users, and 8% have an unknown gender. This distribution shows a higher proportion of male users compared to females.
Here is the table that presents the gender breakdown among Roblox users
| Gender | % of Roblox Users |
| Male | 53% |
| Female | 39% |
| Unknown | 8% |
Source: Statista
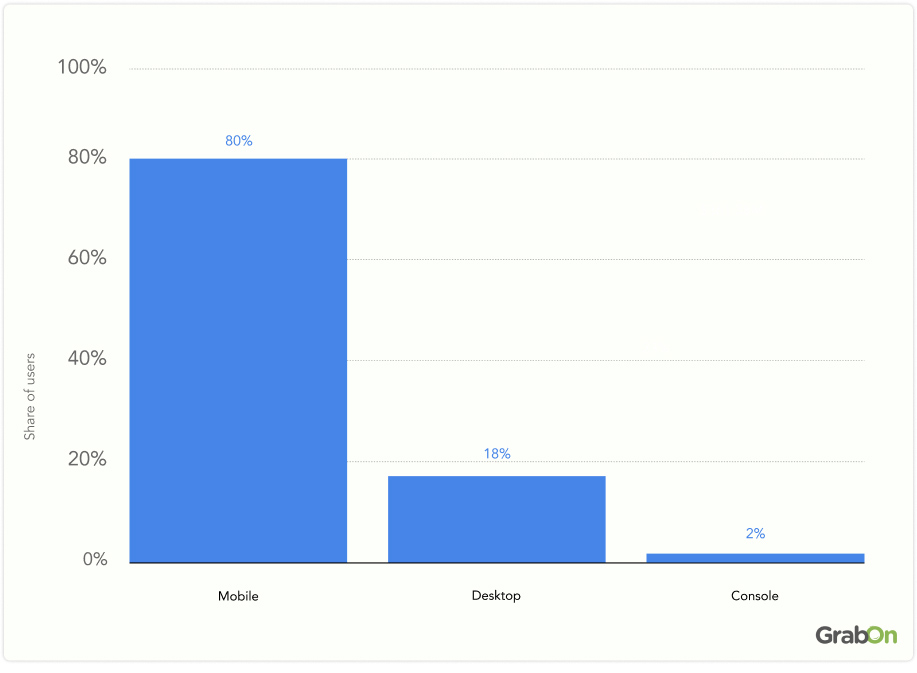
Distribution of Roblox users by Devices
80% of Roblox users access the platform via mobile devices, making it the most popular choice. Desktop users account for 18%, while only 2% use consoles. This data highlights that mobile devices are the dominant platform for Roblox, reflecting their convenience and widespread use.
Here is the table showing the percentage of Roblox users by devices
| Devices | % of Roblox Users |
| Mobile | 80% |
| Desktop | 18% |
| Console | 2% |
Source: Statista
Roblox Users by Region
28% of Roblox users come from Europe, making it the hottest region for the platform. The Asia Pacific region comes next, with 23% of the user base, while the United States and Canada together account for 22%. This distribution shows that Roblox has a strong presence in Europe and a balanced user base across other regions.
Here is the table showing the percentage of Roblox users by region
| Regions | % of Roblox Users |
| United States and Canada | 22% |
| Europe | 28% |
| Asia Pacific | 23% |
| Rest of World | 27% |
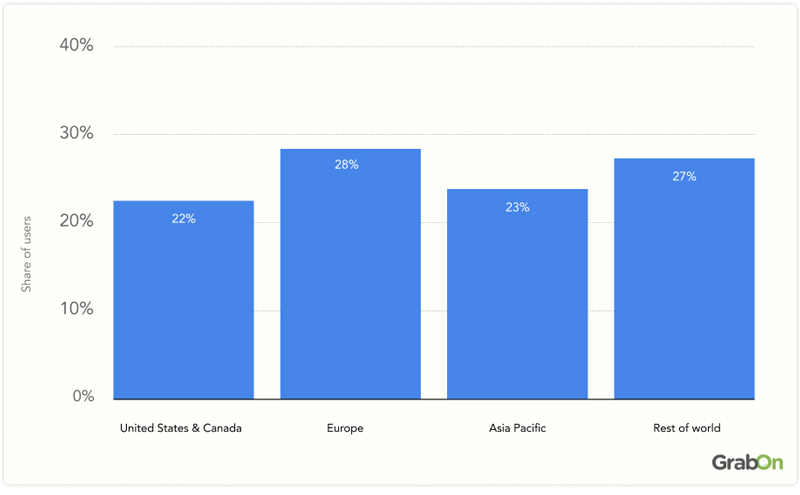
Source: Statista
Total User Engagement on Roblox by Hours
526 games on Roblox have achieved over 10 million hours of user engagement. Following this, 3,200 games have surpassed 1 million hours of play. Notably, there are 7.9 million games with no recorded hours of engagement.
This disparity likely reflects the varying appeal and quality of games on the platform. High engagement hours among certain games may be attributed to their strong user retention, frequent updates, and engaging content. In contrast, many games may struggle to maintain prolonged user interest, resulting in lower engagement figures.
Here is the table detailing Roblox Experience Engagement by Hours
| No. of Games on Roblox | Total Hours |
| 7,900,000 | >0 hours |
| 69,400 | 1k+Hours |
| 21,100 | 10k+Hours |
| 10,000 | 100k+Hours |
| 3,200 | 1million Hours |
| 526 | 10million hours |
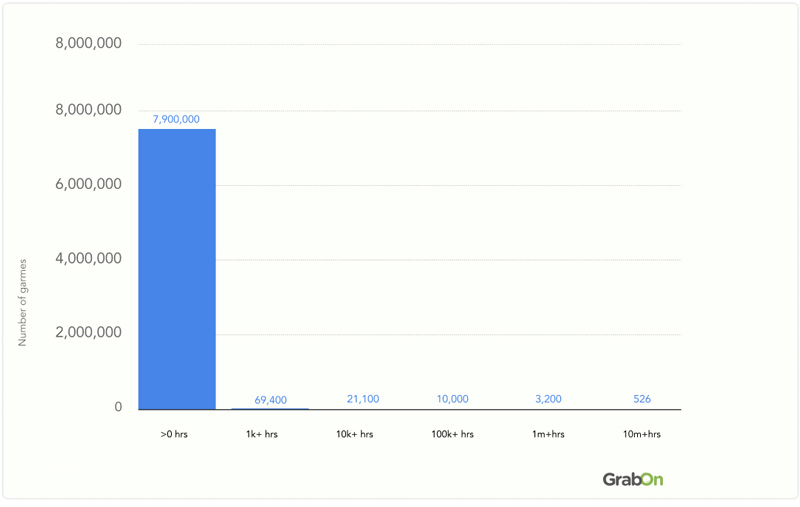
Source: Statista
Roblox App Revenue
In 2024 Q4, Roblox generated $307.84 million in revenue from its app. This marks a slight decline of $17.38 million from 2024 Q3, where the revenue reached $325.22 million. Even with this small dip, the earnings are still quite strong and much higher than what Roblox made in earlier years.
Here is the table displaying Roblox app’s total revenue
| Year | Roblox App Revenue |
| 2021 (Q1) | $242.16 Million |
| 2021 (Q2) | $242.51 Million |
| 2021 (Q3) | $225.15 Million |
| 2021 (Q4) | $230.12 Million |
| 2022 (Q1) | $226.4 Million |
| 2022 (Q2) | $182.81 Million |
| 2022 (Q3) | $206.67 Million |
| 2022 (Q4) | $215.84 Million |
| 2023 (Q1) | $225.79 Million |
| 2023 (Q2) | $227.14 Million |
| 2023 (Q3) | $238.98 Million |
| 2023 (Q4) | $261.21 Million |
| 2024 (Q1) | $267.77 Million |
| 2024 (Q2) | $276.61 Million |
| 2024 (Q3) | $325.22 Million |
| 2024 (Q4) | $307.84 Million |
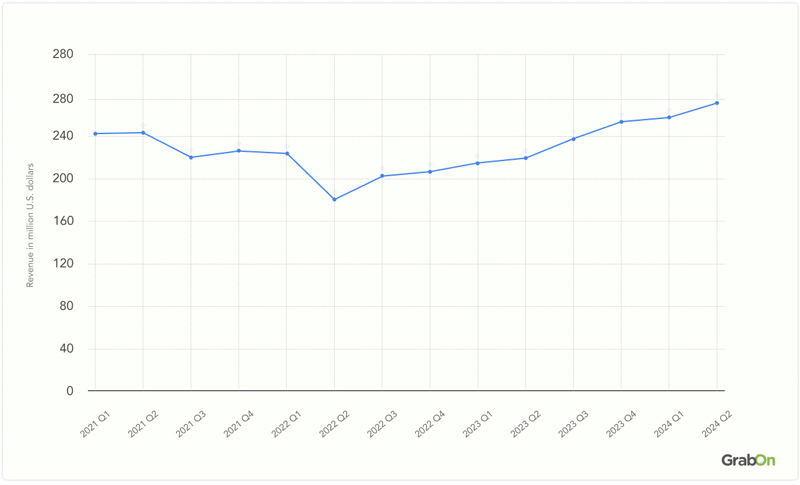
Source: Statista, Roblox Press Release
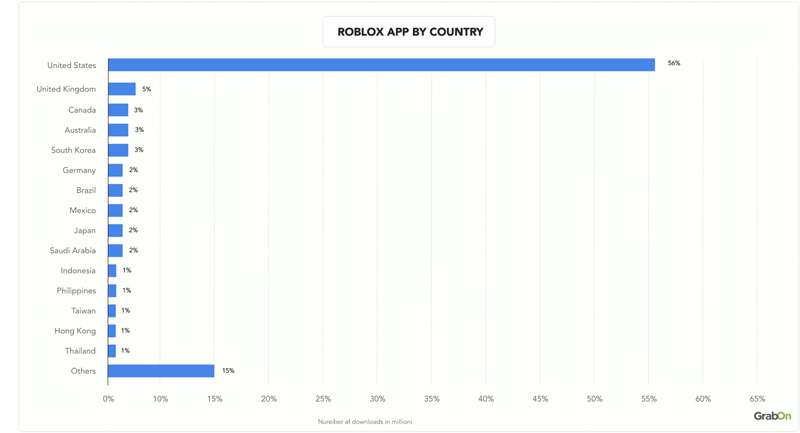
Roblox App Player Spending by Country
The United States accounts for 56% of player spending on the Roblox app, positioning it as the top spender. The United Kingdom accounts for 5% of the total spending, while Canada, Australia, and South Korea each contribute 3%.
The Others category, which includes spending from various other countries, makes up 15% of the total. This data shows that the United States dominates player spending on Roblox, while other regions collectively contribute a smaller share.
Here is the breakdown of player spending on the Roblox app by country
Player Spending on Roblox Mobile App by Region
The data shows how Roblox mobile player spending is spread across different regions. The United States leads with a huge 56% of the total spending, which is more than half of the global amount.
On the other hand, Japan and Mexico have the lowest individual shares, with just 2% each. Other countries like the United Kingdom and South Korea follow with 5%, while Australia and Canada contribute 3% each. The data clearly shows that Roblox’s mobile revenue is heavily dependent on the U.S. market, which stands far above all other regions.
Here is the breakdown of player spending on the Roblox app by Regions
| Regions | % of Roblox mobile player spending worldwide |
| United States | 56% |
| United Kingdom | 5% |
| South Korea | 5% |
| Australia | 3% |
| Canada | 3% |
| Japan | 2% |
| Mexico | 2% |
| Others | 24% |
Source: Statista
Top Revenue-Generating Mobile Game Development Apps Worldwide
Roblox is the top revenue-generating mobile game development app, with a revenue of $226 million. The second highest revenue earner is Rec Room – Play With Friends, which has generated $563,144. BlockmanGoVN ranks third, with a revenue of $48,375. This highlights Roblox’s dominant position in the market compared to other popular mobile game apps.
Here is a table of the top revenue-generating mobile game apps
| Popular Mobile Games | Total Revenue |
| Roblox | $226 Million |
| Rec Room – Play With Friends | 563,144 |
| BlockmanGoVN | 48,375 |
| BUD – Create, Play and Hangout | 41,213 |
| Fancade | 8,654 |
| Struckd – 3D Game Creator | 8,603 |
| Draw Stick | 1,288 |
| HypeHype: Play With Friends | 87 |
| Papelria Sandbox: Online World | 45 |
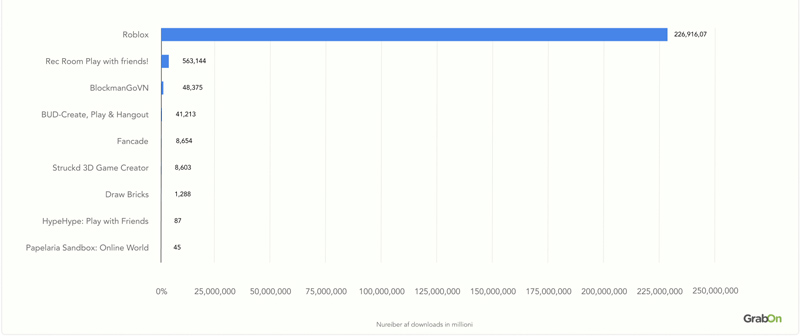
Source: Statista
Average bookings per daily active user of Roblox games
In 2024 Q4, the average bookings per daily active Roblox user reached $15.97, this is an increase from 2024 Q3, where the average was $12.70, reflecting a growth of about $3.27. Overall, the numbers reflect a positive trend in terms of user spending and show that Roblox's monetization strategies are having a good impact on user behavior.
Here is the table showing the average bookings per daily active Roblox user
| Year | Average Bookings Per Daily Active Users |
| 2021 (Q1) | $15.48 |
| 2021 (Q2) | $15.41 |
| 2021 (Q3) | $13.49 |
| 2021 (Q4) | $15.57 |
| 2022 (Q1) | $11.67 |
| 2022 (Q2) | $12.25 |
| 2022 (Q3) | $11.94 |
| 2022 (Q4) | $15.29 |
| 2023 (Q1) | $11.7 |
| 2023 (Q2) | $11.92 |
| 2023 (Q3) | $11.96 |
| 2023 (Q4) | $15.75 |
| 2024 (Q1) | $11.89 |
| 2024 (Q2) | $12.01 |
| 2024 (Q3) | $12.7 |
| 2024 (Q4) | $15.97 |
In Q4 2024, Roblox reached a total revenue of $988.2 million, this is an increase from Q3 2024, when the revenue was $919 million, reflecting a growth of $69.2 million. The overall trend shows a consistent upward movement in revenue, especially as the company moves into 2024, where every quarter has outperformed the last.
Here is the table displaying Roblox’s total revenue.
| Year | Total Roblox Revenue |
| 2020(Q1) | $161.6 Million |
| 2020(Q2) | $200.4 Million |
| 2020(Q3) | $251.9 Million |
| 2020(Q4) | $310 Million |
| 2021 (Q1) | $387 Million |
| 2021 (Q2) | $454.1 Million |
| 2021 (Q3) | $509.3 Million |
| 2021 (Q4) | $568.77 Million |
| 2022 (Q1) | $537.1 Million |
| 2022 (Q2) | $591.2 Million |
| 2022 (Q3) | $517.7 Million |
| 2022 (Q4) | $579 Million |
| 2023 (Q1) | $655.3 Million |
| 2023 (Q2) | $680.8 Million |
| 2023 (Q3) | $713.2 Million |
| 2023 (Q4) | $749.9 Million |
| 2024 (Q1) | $801.3 Million |
| 2024 (Q2) | $893.5 Million |
| 2024 (Q3) | $919 Million |
| 2024 (Q4) | $988.2 Million |
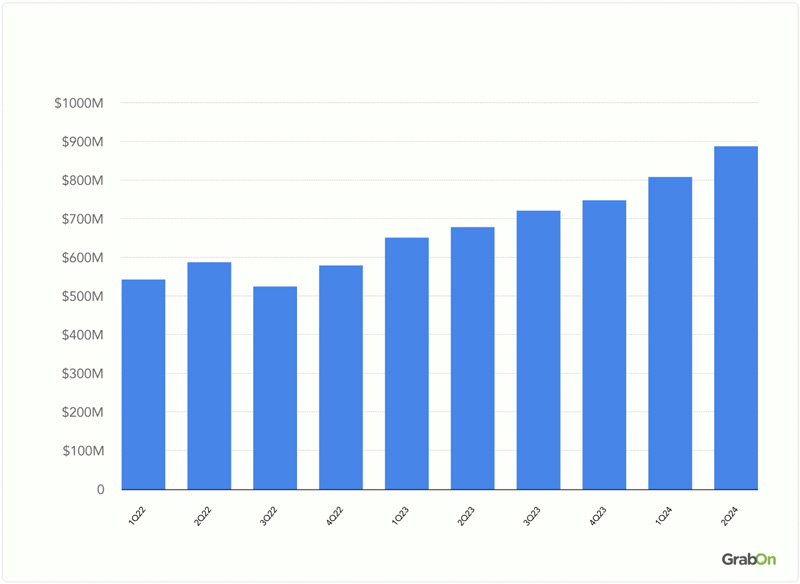
Source: Statista, Roblox Press Release, Roblox Supplement Materials
Net Bookings generated by Roblox worldwide
In Q4 2024, Roblox generated $1,361 million in net bookings, marking a significant jump from Q3 2024, where net bookings were $1,128 million. This represents a growth of $233 million between the two quarters, showing a strong end to the year. The consistent upward trend in net bookings showcases Roblox’s ongoing success and its ability to continue attracting users and generating revenue.
| Year | Net bookings generated by Roblox (Worldwide) |
| 2020(Q1) | $249.6 Million |
| 2020(Q2) | $494.2 Million |
| 2020(Q3) | $496.5 Million |
| 2020(Q4) | $642.3 Million |
| 2021 (Q1) | $652.3 Million |
| 2021 (Q2) | $665.5 Million |
| 2021 (Q3) | $637.8 Million |
| 2021 (Q4) | $770.1 Million |
| 2022 (Q1) | $631.2 Million |
| 2022 (Q2) | $639.9 Million |
| 2022 (Q3) | $701.7 Million |
| 2022 (Q4) | $899.4 Million |
| 2023 (Q1) | $773.8 Million |
| 2023 (Q2) | $708.7 Million |
| 2023 (Q3) | $839.5 Million |
| 2023 (Q4) | $1,126.8 Million |
| 2024 (Q1) | $923.8 Million |
| 2024 (Q2) | $955.2 Million |
| 2024 (Q3) | $1,128 Million |
| 2024 (Q4) | $1,361 Million |
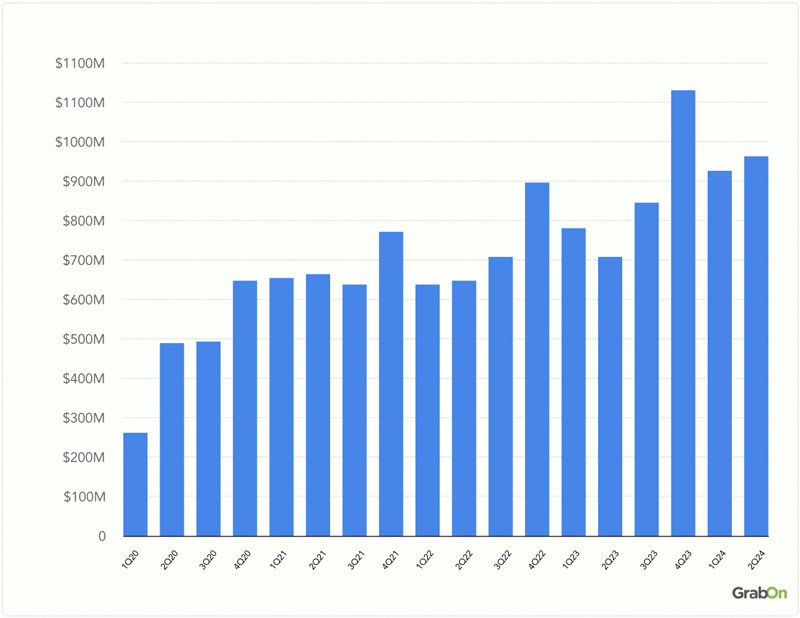
Source: Statista, Roblox Press Release
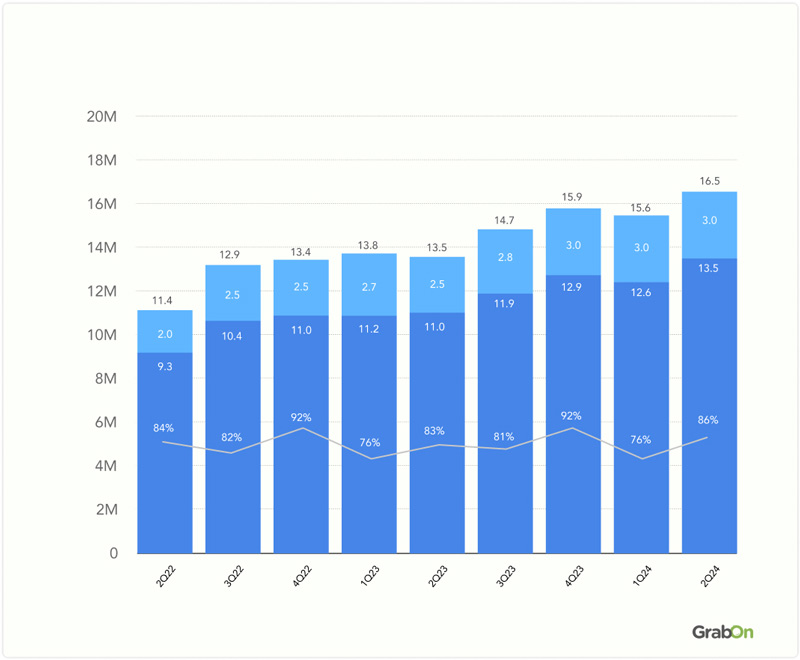
Roblox New and Returning Monthly Unique Payers
In Q2 2024, Roblox saw an increase in average monthly unique payers to 16.5 million, up from 15.6 million in Q1 2024. The number of new payers remained stable at 3.0 million while returning payers grew from 12.6 million in Q1 to 13.5 million in Q2.
Looking ahead to Q4 2024, it’s predicted that the number of unique payers could exceed 17 million, with returning payers possibly reaching around 14 million.
Here is the table displaying the new and returning monthly unique payers for Roblox
| Years | Average Monthly Repurchase Rate | Average New Monthly Unique Payers | Average Returning Monthly Unique Payers |
| 2022(Q2) | 11.4 Million | 2.0 Million | 9.3 Million |
| 2022(Q3) | 12.9 Million | 2.5 Million | 10.4 Million |
| 2022(Q4) | 13.4 Million | 2.5 Million | 11.0 Million |
| 2023(Q1) | 13.8 Million | 2.7 Million | 11.2 Million |
| 2023(Q2) | 13.5 Million | 2.5 Million | 11.0 Million |
| 2023(Q3) | 14.7 Million | 2.8 Million | 11.9 Million |
| 2023(Q4) | 15.9 Million | 3.0 Million | 12.9 Million |
| 2024(Q1) | 15.6 Million | 3.0 Million | 12.6 Million |
| 2024(Q2) | 16.5 Million | 3.0 Million | 13.5 Million |
Source: Press Release