Back-to-School Shopping Statistics in 2025
The back-to-school sales in the United States run from July to August every year. In 2024, US households spent around $128.2 billion on back-to-school and back-to-college shopping. If we break it down further, the back-to-school spending will account for $39.4 billion, while $88.8 billion will come from back-to-college shopping.
61% of consumers in the United States are most likely to start their back-to-school shopping by the end of July, while just 10% will wait until school starts.
In this blog, we have compiled the most up-to-date back-to-school shopping statistics that will provide businesses and marketers with deep insights into how American households plan to manage their back-to-school and back-to-college expenditures this year.
Top Back-to-School Shopping Statistics in 2024
- The estimated spending for back-to-school and back-to-college shopping in 2025 is $128.2 billion.
- A household spends an average of $858 on back-to-school and $1,326 on back-to-college shopping.
- Back-to-school spending in the US is estimated to fall to $39.4 billion this year, an increase of 0.51% from the previous year.
- An average household spends around $570 for their back-to-school shopping per child in the US in 2025.
- 46% of parents plan to take on debt for their kids’ back-to-school shopping due to social pressure.
- 60% of Americans plan to pay for back-to-school shopping with a debit card.
Back-to-School Spending Statistics
The back-to-school spending of households in the United States is expected to decrease from the previous year, with many parents blaming the decrease on the current economic conditions. Most households spend most of their budget on electronic equipment, followed by clothing and shoes. Here are some key back-to-school spending statistics to know:
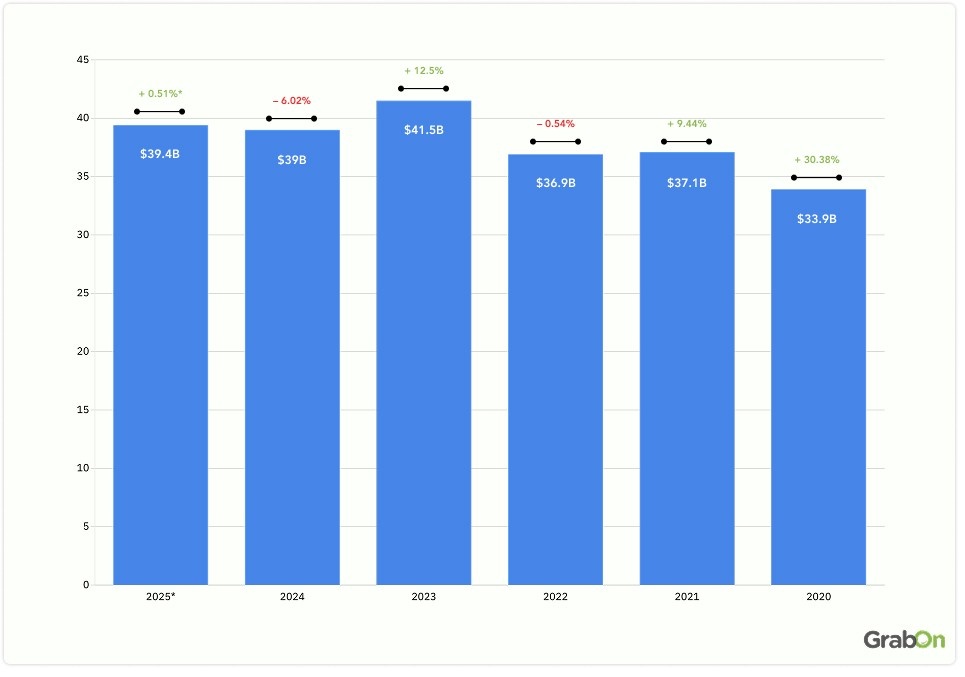
- American households are expected to spend about $39.4 billion on K-12 back-to-school shopping in 2025. This will be 0.51% more than in 2024, which was $39 billion.
The table below shows the total spending on back-to-school shopping of US households:
| Year | Total Back-to-School Spending | Year-on-Year Change |
| 2025* | $39.4 billion* |
|
| 2024 | $39 billion | 6.02% |
| 2023 | $41.5 billion | + 12.5% |
| 2022 | $36.9 billion | 0.54% |
| 2021 | $37.1 billion | + 9.44% |
| 2020 | $33.9 billion | + 30.38% |
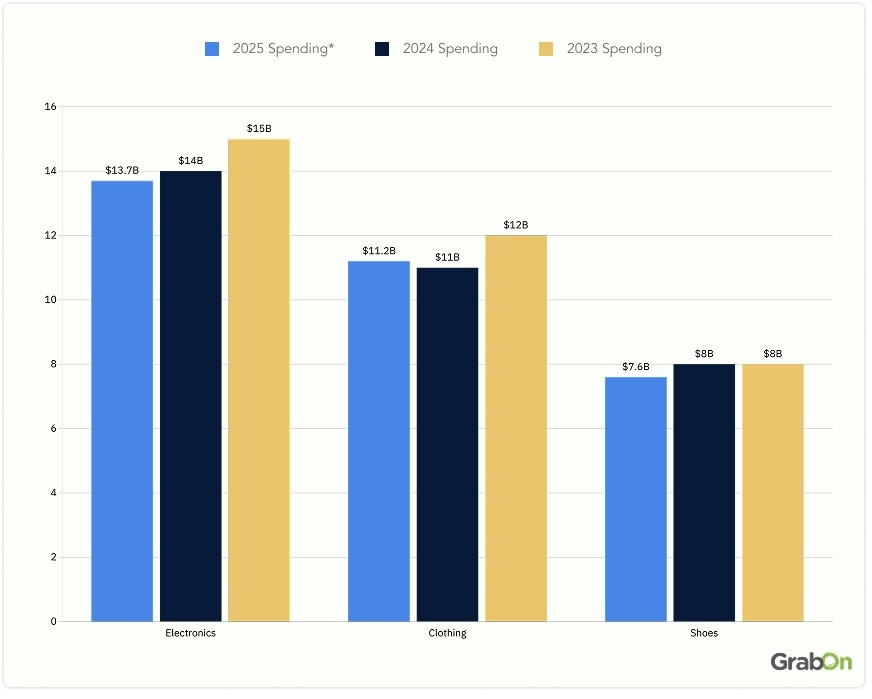
- Families in the United States plan to spend about $13.7 billion on electronics during back-to-school shopping, which will make up 35.13% of total back-to-school spending.
- Electronic spending of American households is expected to decrease by 2.14% from $14 billion in 2024 to $13.7 billion in 2025.
- US parents will spend around $11.2 billion on school clothing for back-to-school shopping. This will be an 1.82% increase from the previous year’s $11 billion.
- Parents in the United States are planning to spend approximately $7.6 billion on shoes during their back-to-school shopping, maintaining the same expenditure as the previous year.
Here is the table showing the total back-to-school expenditure of US households by categories:
| Category | 2025 Spending* | 2024 Spending | 2023 Spending |
| Electronics | $13.7 billion | $14 billion | $15 billion |
| Clothing | $11.2 billion | $11 billion | $12 billion |
| Shoes | $7.6 billion | $8 billion | $8 billion |
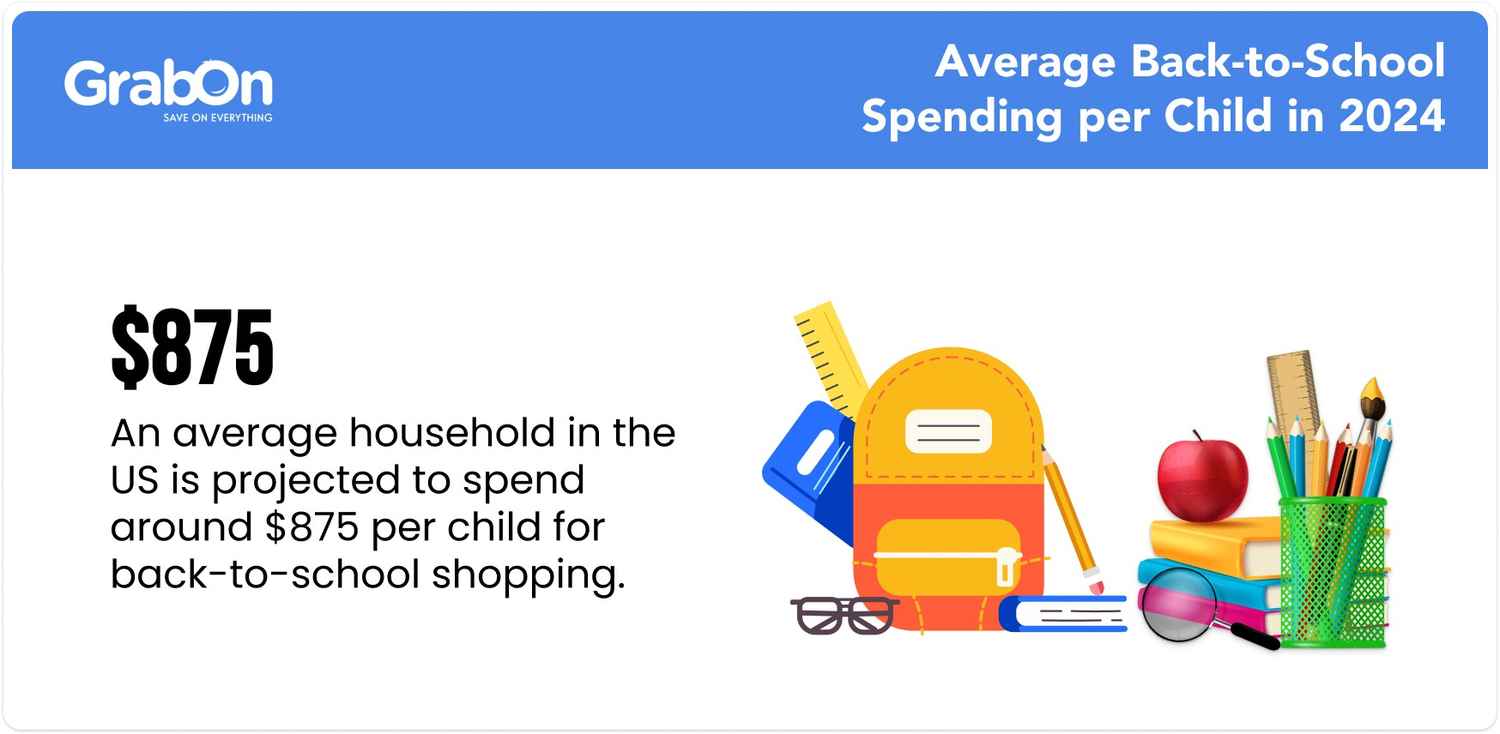
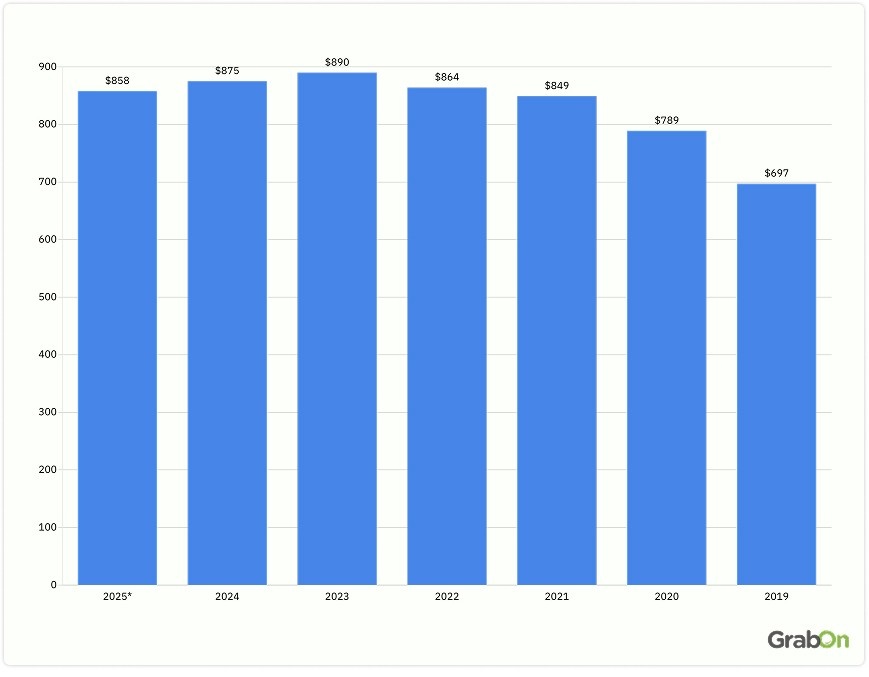
- An average American household is expected to spend about $858 on back-to-school shopping in 2025. This will be a 1.94% drop from $875 in 2024.
- American households have spent an average of $853.4 for back-to-school shopping in the last 5 years.
Let's check the back-to-school spending of an average US household over the past few years:
| Year | Average back-to-school spending per US household |
| 2025* | $858* |
| 2024 | $875 |
| 2023 | $890 |
| 2022 | $864 |
| 2021 | $849 |
| 2020 | $789 |
| 2019 | $697 |
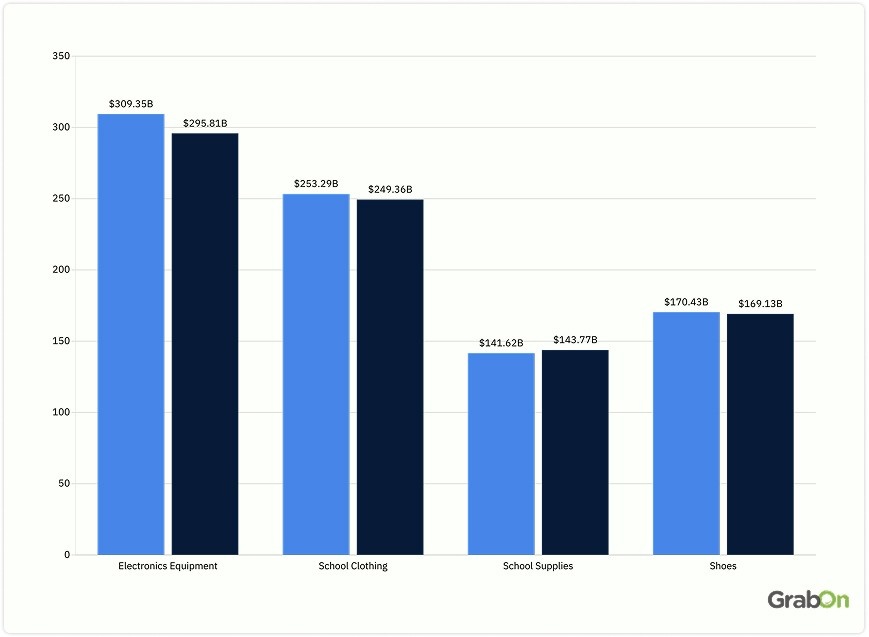
- An average American household is estimated to spend around $295.81 on purchasing electronics equipment for back-to-school shopping in 2025. This will be a 4.38% drop from $309.35 in 2024.
- Households in the United States plan to spend an average of $249.36 on school clothing and accessories, $169.13 on shoes, and $143.77 on school supplies in 2025.
The table below shows the average spending of American households on different categories for back-to-school shopping in 2025:
| Category | Average amount spent in 2025* | Average amount spent in 2024 | Year-on-year change |
| Electronics Equipment | $295.81 | $309.35 | 4.38% |
| School Clothing | $249.36 | $253.29 | 1.55% |
| School Supplies | $143.77 | $141.62 | + 1.52% |
| Shoes | $169.13 | $170.43 | 0.77% |
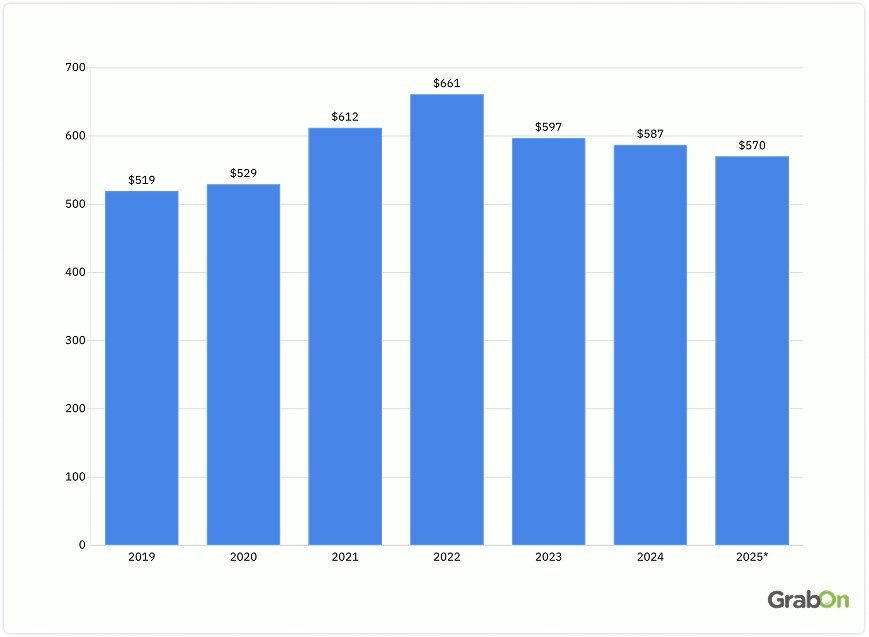
- The average back-to-school spending per child in the US is estimated at around $570 in 2025, down by 2.90% or $17 from $587 in 2024. The average per-child spending is growing negatively since 2023.
Here is the table that shows the average back-to-school spending per child over the years:
| Year | Average back-to-school spending per child |
| 2025* | $570* |
| 2024 | $587 |
| 2023 | $597 |
| 2022 | $661 |
| 2021 | $612 |
| 2020 | $529 |
| 2019 | $519 |
- High-income American households plan to increase their back-to-school spending per child by 46.30% this year, from $419 in 2024 to $613 in 2025. Meanwhile, middle-income and low-income households in the country are projected to also increase their spending by 51.09% and 51.04% this year, respectively.
The table below shows the change in the average back-to-school spending per child by household income:
| Household Income | 2025 Spending | 2024 Spending | Year-on-Year Change |
| Low-income Household (Less than $50k) | $613 | $419 | + 46.30% |
| Middle-income Household ($50k to $99k) | $834 | $552 | + 51.09% |
| High-income Household ($100k+) | $1,090 | $721 | + 51.04% |

- 6 out of 10 low-income households in the US plan to reduce their other expenses to cover back-to-school costs. Meanwhile, 57% of middle-income families and only 39% of high-income households will make similar adjustments.
- Half of American back-to-school shoppers have less money for back-to-school shopping, while 44% of them blame the current economy as the reason for their reduced spending. Meanwhile, a whopping 67% of them will cut their back-to-school spending due to price hikes.
Back-to-School Shopping Statistics
A majority of back-to-school shoppers in the United States plan to make their purchases from mass merchant retailers, like Best Buy, Target, Walmart, etc. Reports also revealed that some of the consumers are most likely to go for secondhand products, like clothes, school supplies, electronics, and shoes. Below are some key back-to-school shopping statistics:
- 83% of American shoppers prefer to do their back-to-school shopping from mass merchant retailers. While around 68% of them like to shop from online retailers. Another 39% of families visit department stores for their back-to-school shopping.
The table below shows what retail formats US households prefer during back-to-school shopping:
| Retail Format | Share of American Households Choosing |
| Mass merchant retailers | 83% |
| Online retailers | 68% |
| Department stores | 39% |
| Off-price retailers | 38% |
| Dollar stores | 32% |
| Specialty clothing retailers | 30% |
| Warehouse membership clubs | 30% |
| Office supply/technology retailers | 23% |
| Supermarkets | 19% |
| Retailers that sell used or refurbished items | 21% |
| Home electronics retailers | 15% |
| Fast fashion apparel retailers | 15% |
| Bookstores | 14% |
| Ultra-fast fashion retailers | 15% |
| Peer-to-peer selling platforms | 10% |
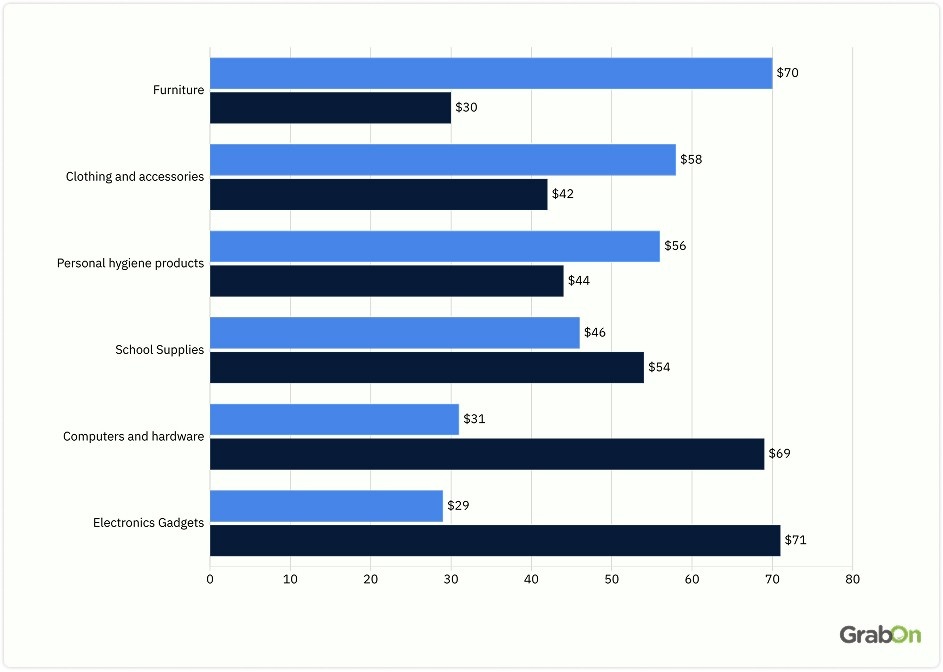
- 7 out of 10 US consumers like to do their back-to-school furniture shopping from offline stores for the quality of products, while around 30% of them like to shop from online stores.
- 58% of American back-to-school shoppers prefer doing clothing and accessories shopping from offline stores.
Here is the table that shows the store preference for American families for back-to-school shopping:
| Product Category | Share of US families shopping in-store | Share of US families shopping online |
| Furniture | 70% | 30% |
| Clothing and accessories | 58% | 42% |
| Personal hygiene products | 56% | 44% |
| School Supplies | 46% | 54% |
| Computers and hardware | 31% | 69% |
| Electronics Gadgets | 29% | 71% |
Back-to-School Consumer Behavior Statistics
Most of the shoppers in the US plan to make payments for their back-to-school shopping through debit and credit cards. A few of them also prefer using the Buy Now, Pay Later services. Here are some of the important back-to-school consumer behavior statistics:
- 5 out of 10 US consumers start their back-to-school shopping by early July, while 42% of them start by July end after receiving their school lists.
- Half of U.S. back-to-school shoppers plan to start their purchases 1 to 3 weeks before school begins, while 27% begin shopping at least 2 months ahead. Only 5% of them begin their shopping the week school starts or later.
The table below shows the shopping timing of back-to-school shoppers in the United States:
| Time Period | Share of shoppers doing their back-to-school shopping |
| The week school starts or later | 5% |
| At least 2 months before school starts | 27% |
| 1-2 weeks before school starts | 21% |
| 3 weeks to 1 month before school starts | 47% |

- Over 49% of back-to-school consumers in the United States prefer shopping early to spread their shopping budget.
- 46% of US shoppers prefer to do their back-to-school shopping exclusively during Amazon Prime Day for deals.
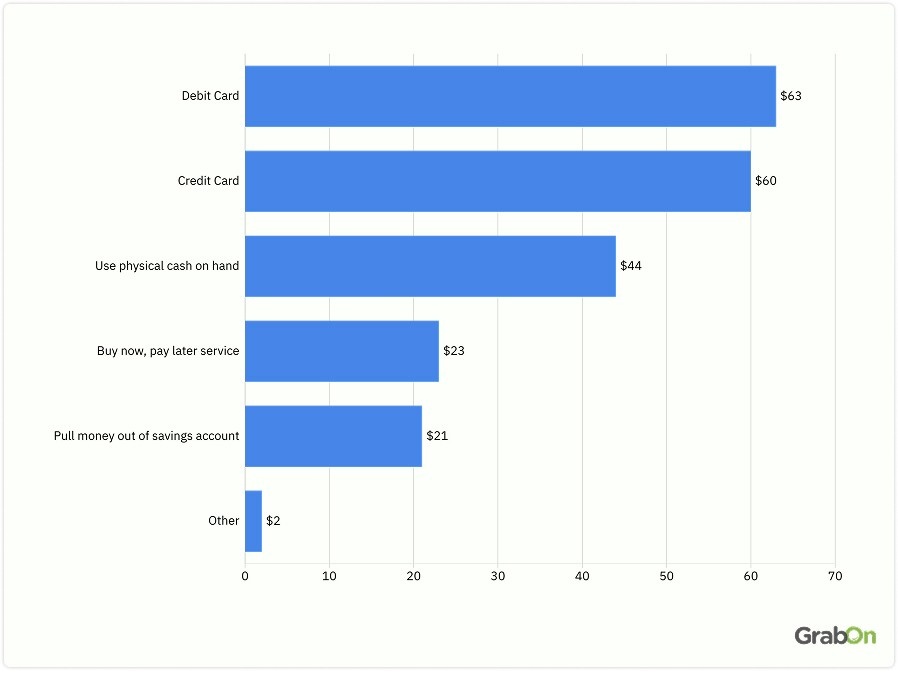
- 6 out of 10 consumers in the U.S. prefer paying for back-to-school purchases with debit cards, while 60% use credit cards. Another 44% of them use cash for their shopping.
The table below showcases the mode of payment of back-to-school shoppers in the United States:
| Payment Mode | Share of back-to-school shoppers using it |
| Debit Card | 63% |
| Credit Card | 60% |
| Use physical cash on hand | 44% |
| Buy now, pay later service | 23% |
| Pull money out of savings account | 21% |
| Other | 2% |
- 1/3rd of American online back-to-school shoppers use the Buy Online, Pickup In-Store (BOPIS) option to purchase, a 57.14% increase from 21% in the previous year.
- 46% of American parents take a debt for their kids’ back-to-school shopping due to social pressure.
Source: NRF, NerdWallet, Deloitte
Back-to-College Spending Statistics
Like back-to-school, the back-to-college expenditures of US households are expected to decrease this year compared to the last year. However, the average budget for electronics equipment and dorms/apartment furnishing is projected to increase from the previous year. Let’s check some of the interesting back-to-college spending statistics:
- American parents are planning to spend about $128.2 billion on back-to-school and back-to-college shopping in 2025, which will be a 1.75% increase from $126 billion in 2024.
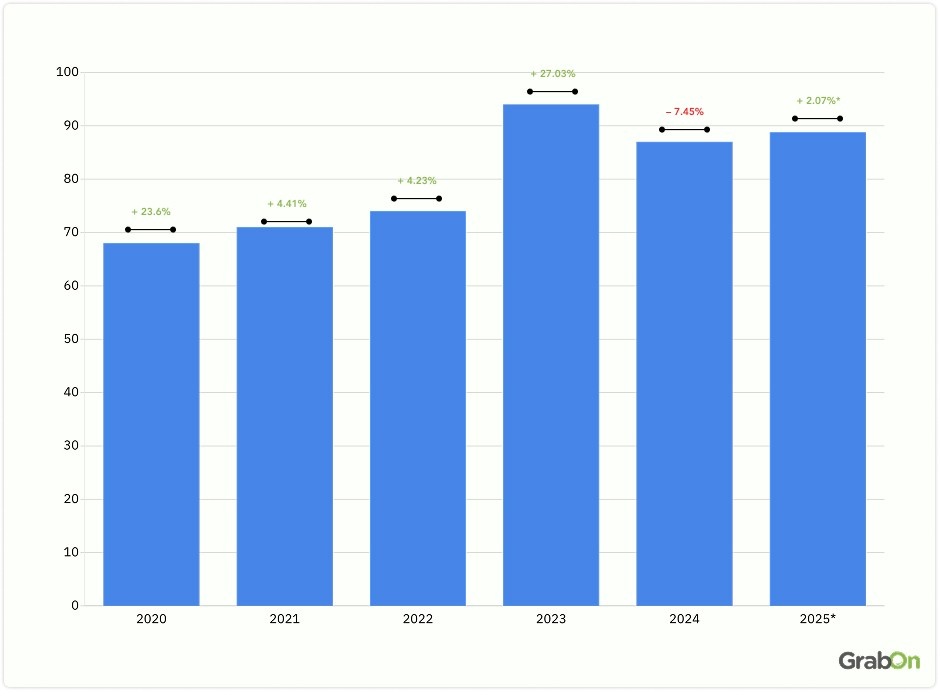
- Households in the United States are expected to spend around $88.8 billion on their back-to-college shopping in 2025. This will be a 2.07% increase from $87 billion in 2024.
Here is the table to show the back-to-college expenditure of American households over the years:
| Year | Total back-to-college spending | Year-on-year change |
| 2025* | $88.8 billion* | + 2.07%* |
| 2024 | $87 billion | 7.45% |
| 2023 | $94 billion | + 27.03% |
| 2022 | $74 billion | + 4.23% |
| 2021 | $71 billion | + 4.41% |
| 2020 | $68 billion | + 23.6% |
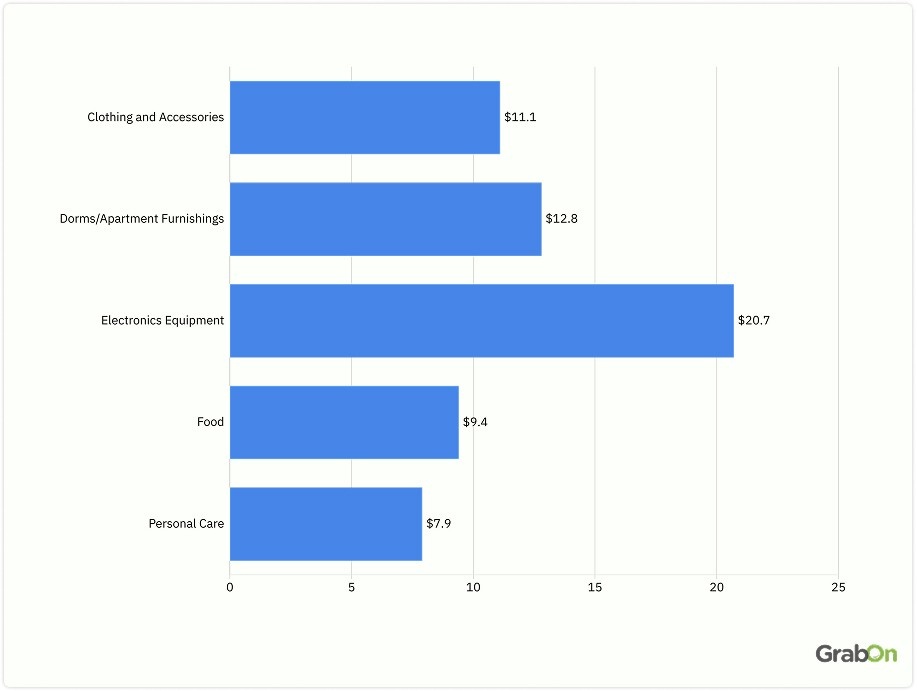
- American households’ electronics equipment expenditure for back-to-college shopping is projected to be $20.7 billion in 2025, a decrease of 10% from $23 billion in the previous year.
- United States households are planning to spend about $12.8 billion on dorms/apartment furnishings during their back-to-college shopping in 2025, a 6.67% increase from $12 billion in 2024.
- Households are expected to spend around $11.1 billion on clothing and accessories for back-to-college shopping in 2025, which will be a 0.91% increase from $11 billion in 2024.
Here is the table that shows the total back-to-college spending by American households in different categories:
| Category | Total back-to-college spending in 2024* |
| Electronics Equipment | $20.7 billion |
| Dorms/Apartment Furnishings | $12.8 billion |
| Clothing and Accessories | $11.1 billion |
| Food | $9.4 billion |
| Personal Care | $7.9 billion |
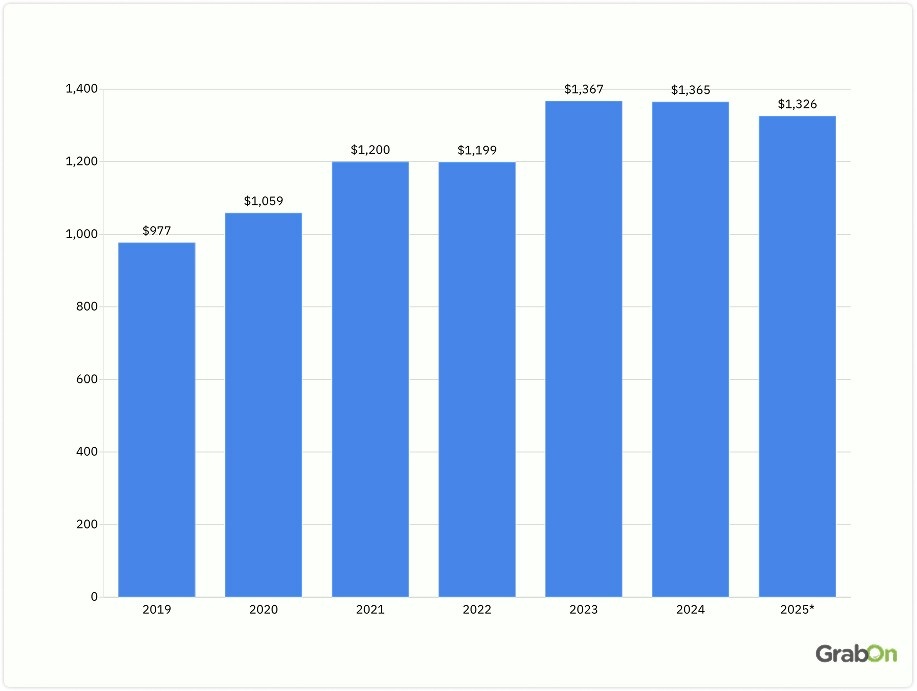
- An average American household will spend around $1,326 on back-to-college shopping in 2025, there will be a 2.86% drop from $1,365 in 2024. This spending is about 10.87% higher than the average weekly salary of an American.
- Households are expected to spend 54.55% more on a single college-going student compared to per K-12 student.
The table below shows the average back-to-college spending of households:
| Year | Average back-to-college spending per household |
| 2025* | $1,326* |
| 2024 | $1,365 |
| 2023 | $1,367 |
| 2022 | $1,199 |
| 2021 | $1,200 |
| 2020 | $1,059 |
| 2019 | $977 |
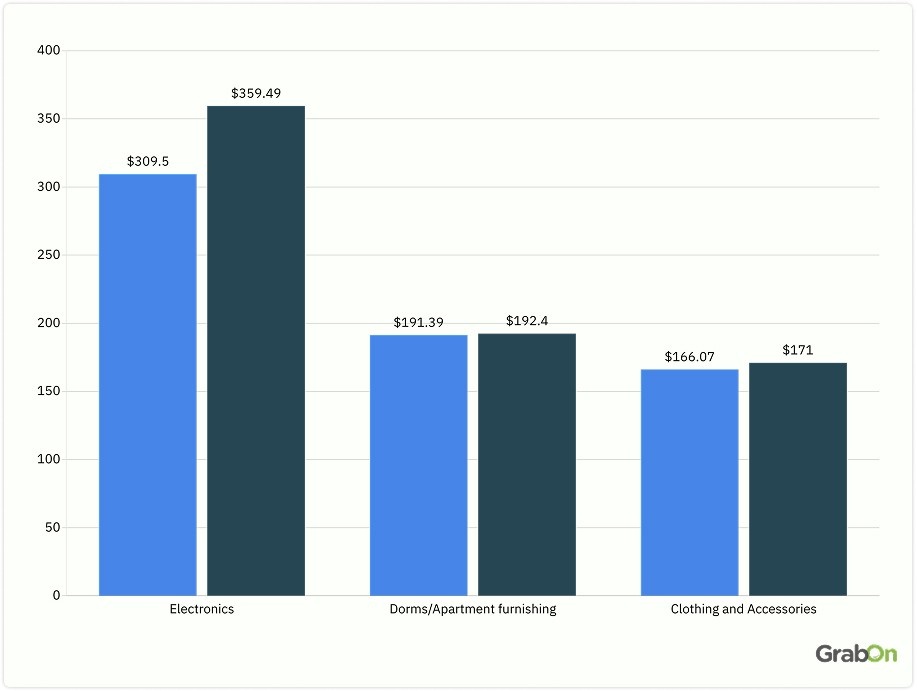
- Households in the United States plan to spend an average of $309.50 on electronics for back-to-college shopping in 2025, a 13.90% decrease from $359.49 in 2024.
- US households will spend around $191.39 on dorms/apartment furnishings and about $166.07 on clothing and accessories for back-to-college shopping in 2025.
Here is the table that shows the average back-to-college spending of an average household by categories:
| Category | Average spending in 2025* | Average spending in 2024 | Year-on-year change |
| Electronics | $309.50 | $359.49 | 13.90% |
| Dorms/Apartment furnishing | $191.39 | $192.40 | 0.52% |
| Clothing and Accessories | $166.07 | $171 | 2.88% |
Source: NRF, Bureau of Labor Statistics
Back-to-College Shopping Statistics
A majority of back-to-college buyers in the US like to purchase from online retailers, like Amazon, Walmart, and others. Some households also like to purchase secondhand products for their back-to-college shopping. Here are some of the key back-to-college shopping statistics you should know:
- 5 out of 10 United States shoppers plan to do their back-to-college shopping from online stores. While, 35% of them opt to shop from department stores, and 31% of shoppers like to purchase at discount stores.
The table below showcases the retail formats back-to-college shoppers in the United States purchase from:
| Retail Formats | Share of back-to-college shoppers choosing it |
| Online | 50% |
| Clothing Store | 28% |
| Office Supply Store | 26% |
| College Bookstore | 26% |
| Electronics Store | 17% |
| Home Furnishings/Decor Store | 15% |
| Department Store | 35% |
| Discount Store | 31% |
| Local/Small Business | 14% |
| Thrift/Resale Shop | 9% |
| Catalog | 8% |
| Drug Store | 10% |
- 4 out of 10 back-to-college shoppers in the United States plan to do more comparative shopping online due to bad economic conditions. While 37% of them like to shop only during sales and 31% choose to purchase more generic products.
- 4 out of 10 US consumers like to purchase textbooks secondhand for back-to-college shopping, while 31% prefer buying secondhand clothing and accessories. Another 23% of buyers look for secondhand electronics equipment and only 22% of them choose secondhand school supplies.
Source: NRF
Back-to-College Consumer Behavior Statistics
Most American back-to-college consumers like to start their shopping in July; however, a few of them wait till their college starts. During back-to-college sales, a variety of brands and retailers offer exciting deals which a majority of shoppers wait for. Here are some key back-to-college consumer behavior statistics:
- 67% of US back-to-college shoppers began their shopping in July 2025.
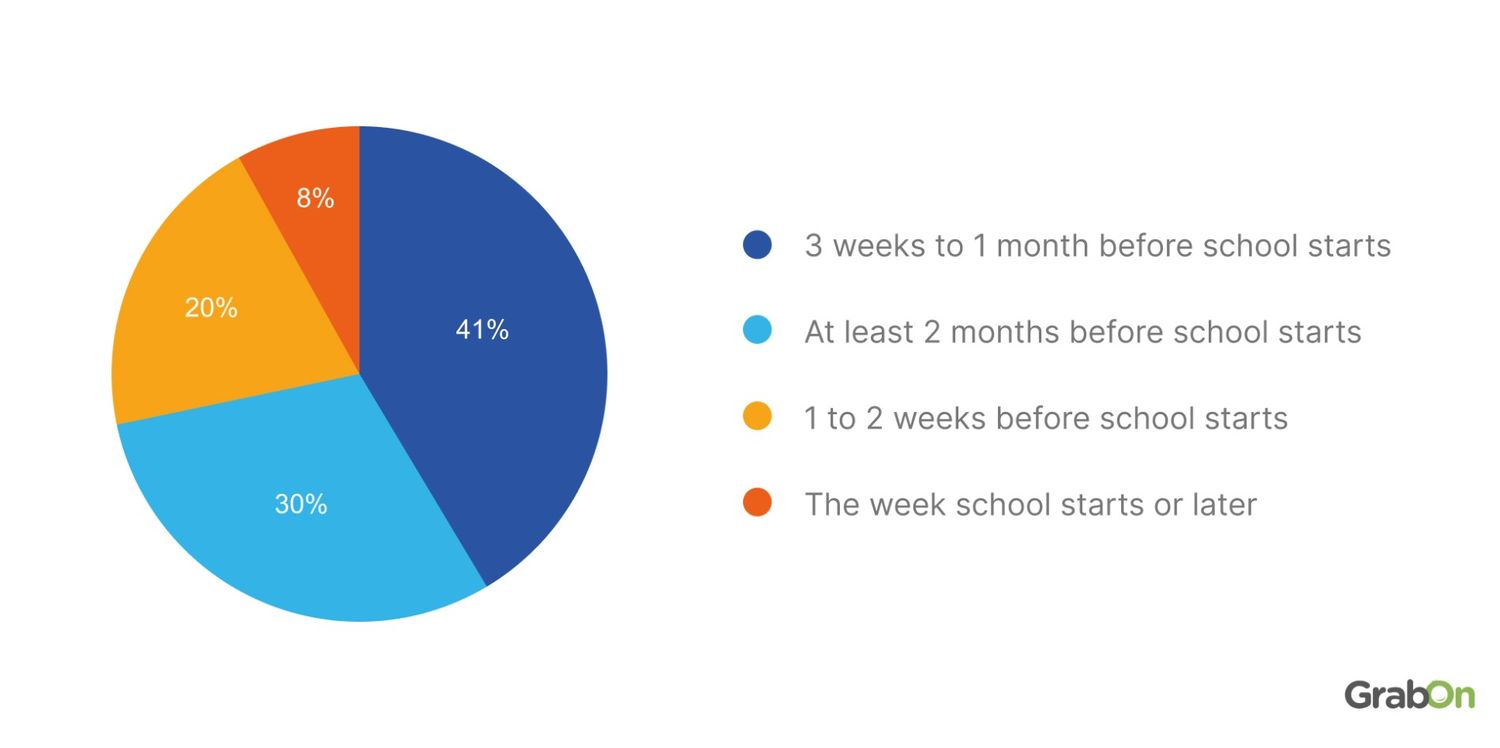
- 4 out of 10 consumers in the United States plan to start their back-to-college shopping 3 weeks to 1 month before their college starts, while 30% like to do their shopping before 2 months.
- 20% of American back-to-college consumers prefer to shop 1 to 2 weeks before their college starts, while only 8% shop during or after the first week of college.
Here is the table to show the timing of American shoppers to start their back-to-college shopping:
| Time Period | Share of Americans start back-to-college shopping |
| 3 weeks to 1 month before school starts | 41% |
| At least 2 months before school starts | 30% |
| 1 to 2 weeks before school starts | 20% |
| The week school starts or later | 8% |
- Around half of back-to-college buyers in the U.S. choose to buy early to take advantage of exciting deals and promotions.
Source: NRF
Conclusion
Back-to-school sales in the United States are one of the biggest sales of the year; however, this year households’ expenditures have decreased than the previous year. It is projected that the back-to-school spending will cross $40 billion in 2025, a 2.56% increase from this year. Every year over 90% of American households plan to spend on their back-to-school and back-to-college shopping. Brands and retailers must look into this number and introduce more exciting deals to increase their sales numbers.