Amazon Prime Day Sales Data ( 2015 to 2026 Data)

Amazon’s 12th Prime Day sale was held in June 2026, it has moved a month earlier than its traditional timing of July. If you are a seller planning to make the most of this opportunity, you have lesser time than usual this time.
We have compiled the historical sales data in this post for sellers in the United States.
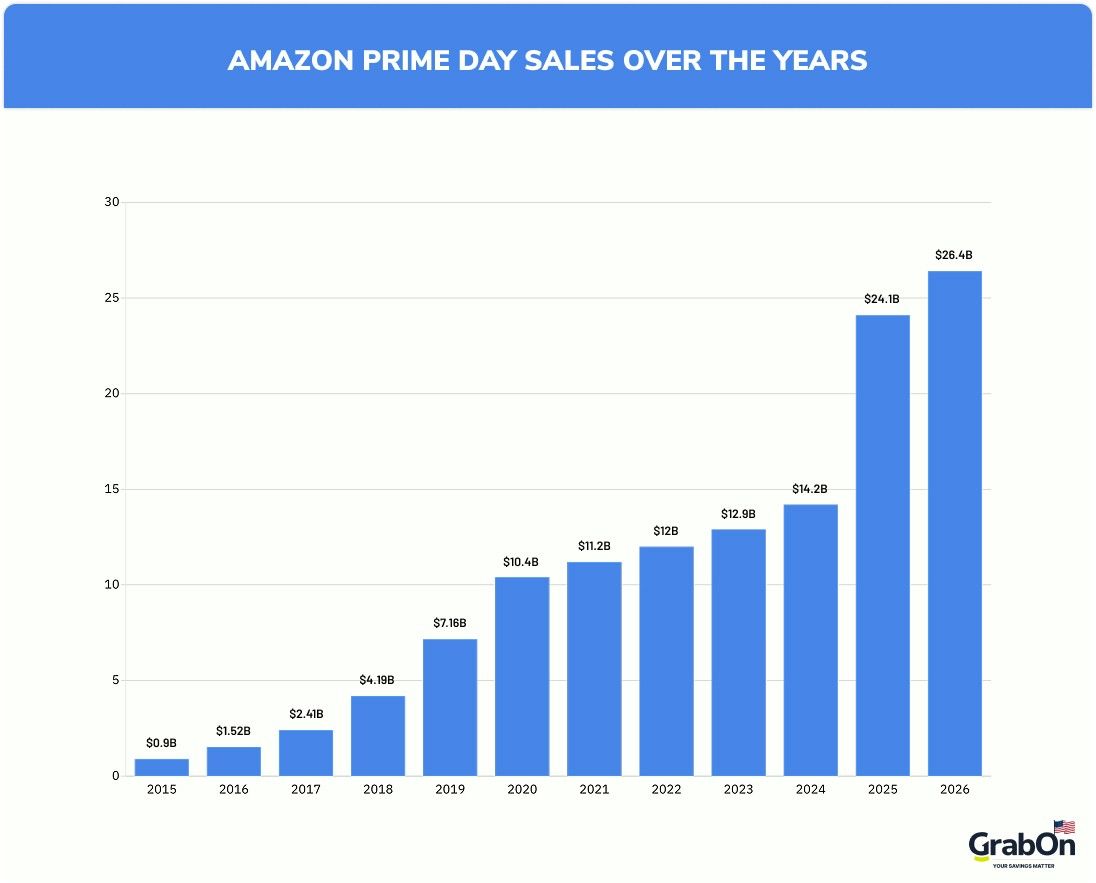
This year, Amazon’s 12th Prime Day kicked off on June 23, and it turned out to be the biggest one yet. Shoppers spent a massive $26.4 billion during the four-day event, marking a 9.3% jump compared to 2025. This year’s Prime Day ran a full four days, saw more sellers joining in, and faced tougher ad competition throughout the sale.
Let’s dive into the key highlights and stats from Prime Days over the years and know the customer behaviour data.
Amazon Prime Day Sales Data Highlights
- Amazon Prime Day 2026 generated an estimated $26.4 billion in U.S. online sales, up 9.3% from 2025.
- It was estimated that 91% of Amazon Prime members will shop during Prime Day 2026.
- The average Prime Day spend per order was $47.66 in 2026, down from $53.34 in 2025.
- Amazon gets around 187.5 million orders per day during Prime Day sales.
Over 91% of Amazon Prime Customers Possibily Shopped In 2026 Prime Day Sale
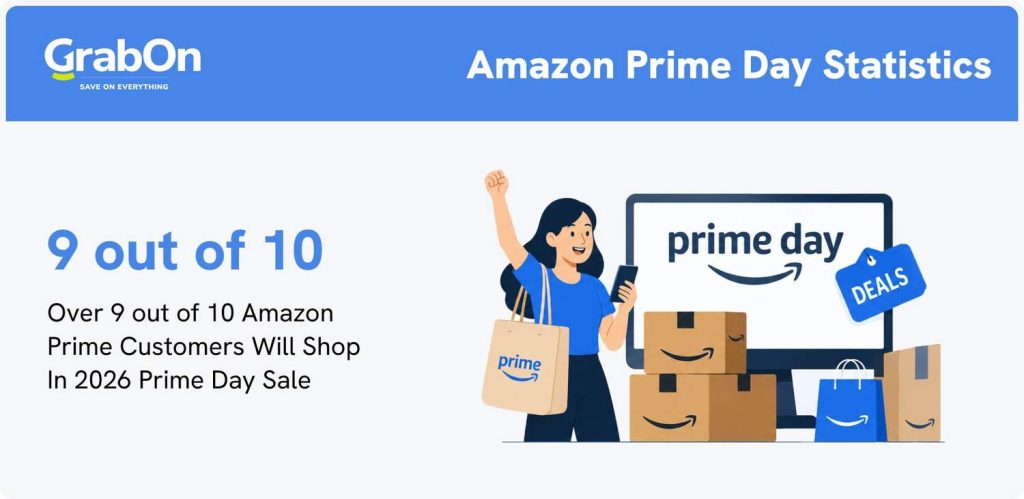
It is estimated that 91% of Amazon Prime customers shopped during the four-day Prime Day 2026 sale. That is equivalent to 182 million shoppers.
People purchase an Amazon Prime subscription just to enjoy access to the sale every year.
Source: USA Today, Jungle Scout
Amazon Prime Day sale figures over the years (2015 to 2026)
Amazon Prime Day 2026 was the largest event in Amazon’s history, generating $26.4 billion in gross merchandise value during the four-day sale period, which is a 9.3% increase from the previous year. Over 307 million products were purchased during the 2025 event, and the average order size in 2026 was $47.66, down from $53.34 a year earlier. That was up from the $24.1 billion recorded in 2025.
| Year | Prime Day Sale Value |
| 2015 | $0.9 billion |
| 2016 | $1.52 billion |
| 2017 | $2.41 billion |
| 2018 | $4.19 billion |
| 2019 | $7.16 billion |
| 2020 | $10.4 billion |
| 2021 | $11.2 billion |
| 2022 | $12 billion |
| 2023 | $12.9 billion |
| 2024 | $14.2 billion |
| 2025 | $24.1 billion |
| 2026 | $26.4 billion |
Source: Amazon, Tech Crunch, Statista.
The number of orders Amazon gets on Prime Day
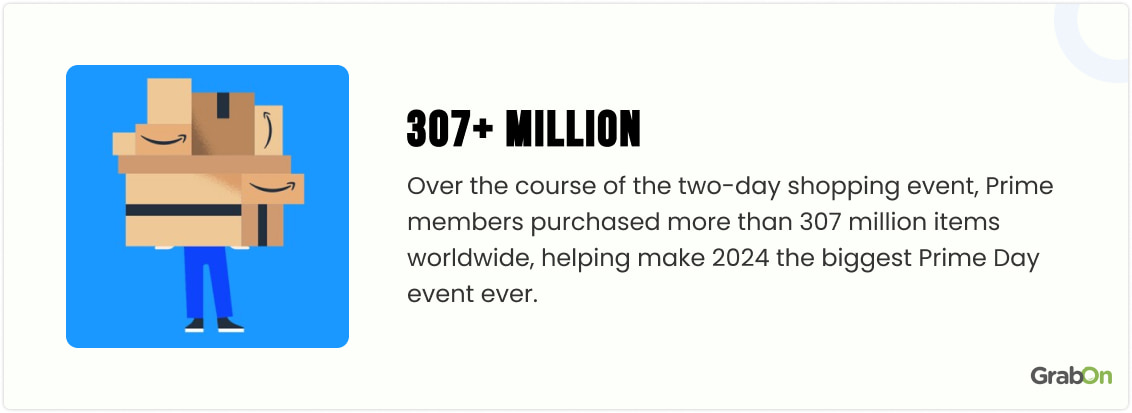
Amazon gets around 187.5 million orders per day during Prime Day. People purchased over 307 million items during Amazon Prime Day 2025. Although the 2026 figures are not disclosed yet, we know that 63% of the households shopping during the Prime Day 2026 ordered at least 2 products.
| Year | Purchase volume |
| 2018 | 100 million |
| 2019 | 175 million |
| 2021 | 250 million |
| 2022 | 300 million |
| 2023 | 375 million |
| 2024 | 300 million |
| 2025 | 307 million |
| 2026 (Projected) | 320 million |
Amazon hosted the first Prime Day on 15th July 2015 with the intention of offering a volume of deals greater than Black Friday, exclusively for Prime members.
No doubt it was a hit as consumers have flocked to this yearly sale more and more each year.
Source: Amazon, eDesk, About Amazon.
The average order value on Amazon Prime Day 202 was $47.66
The average Prime Day spend per order accounted for $47.66 in 2026, a decrease of 10.6% from 2025, when shoppers spent $53.34 per order.
The reason for this drop in average order value can be attributed to the rising inflation rates. Most Prime Members use Prime Day as an inflation-saving strategy.
Here is a table showing the average consumer spending on Amazon Prime Day from 2019 to 2026:
| Year | Avg. Spending Per Customer |
| 2019 | $58.91 |
| 2020 | $54.64 |
| 2021 | $47.14 |
| 2022 | $53.14 |
| 2023 | $56.64 |
| 2024 | $57.97 |
| 2025 | $53.34 |
| 2026 | $47.66 |
Source: Numerator 1.
Ad spend trends during Prime Day
During Prime Day 2025, advertising investment on Amazon surged in the United States. Ad spend on Sponsored Products rose by 29%, while Sponsored Brands saw a 10% increase compared to 2024. Sponsored Display ad spend dropped by 26%, indicating that marketers focused more on product- and brand-driven formats this year.
Source: Statista.
Breakdown of shopping behavior during Amazon Prime Day among generations
Gen Z: Impulse Meets Intention
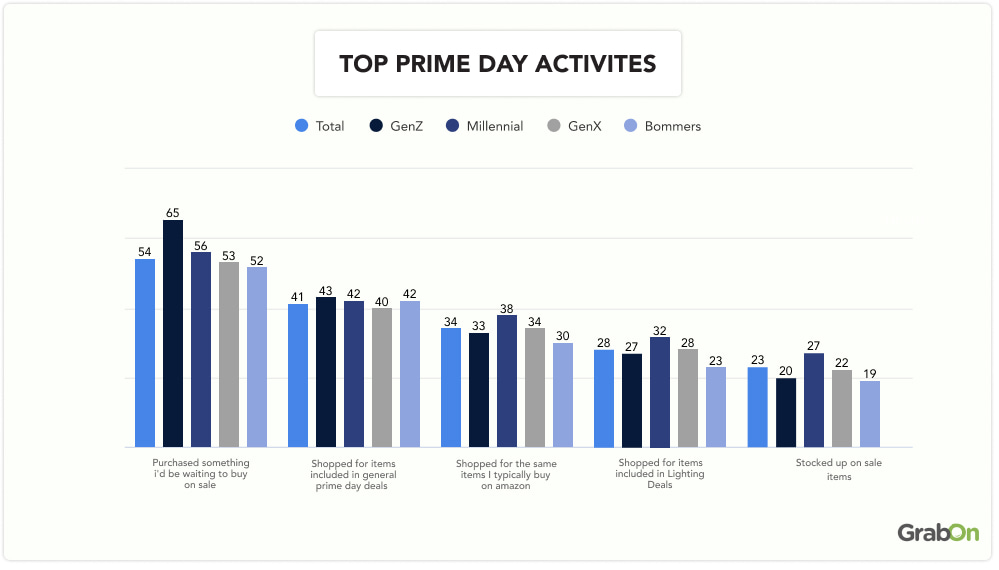
Gen Z shoppers display the highest level of purchase intent on Prime Day, with 65% stating they purchased something they had been waiting to go on sale. Interestingly, only 33% buy routine Amazon items, and just 27% explore Lightning Deals, showing a more curated approach to shopping.
Marketers targeting Gen Z should emphasize countdowns, exclusive savings, and wishlist-based campaigns to convert planned intent into purchases this Prime Day.
Millennials: Deal Hunters & Stockpilers
Millennials emerge as the most strategically deal-driven segment, with 56% waiting for specific items to drop in price, and a standout 38% buying the same products they typically order (the highest among all groups). They also lead in Lightning Deal interest (32%) and sales stockpiling (27%).
If you’re a marketer, consider bundling deals, limited-time offers, and loyalty-based discounts when marketing to Millennials during Prime Day sales.
If you want to cut through the noise and make sure you are getting the absolute best prices, keeping a reliable deal tracker handy is essential. You can find updated offers and Amazon Prime Day coupon codes with the steepest discounts across tech, home, and fashion.
Gen X: Value-Driven and Brand-Loyal
During Prime Days 53% of Gen X wait for price drops on desired items, and 40% engage with general Prime Day deals. A consistent 34% also repeated typical purchases, highlighting brand familiarity and repeat buying behavior. While this generation group responds decently to Lightning Deals (28%), their stock-up rate (22%) suggests more moderate purchasing habits.
For marketers, this group values dependable brands, so retargeting existing customers, promoting product quality, and loyalty perks could drive higher ROI from Gen X.
Boomers: Conservative but Intent-Driven
Boomers maintain steady engagement, with 52% reporting they purchased something they had been waiting to go on sale, nearly matching younger groups. However, participation sharply dropped for other activities: only 30% repeat regular Amazon buys, and 23% and 19% engage with Lightning Deals and stock-ups, respectively.
Marketers looking to target Boomers+ should focus on trust, product necessity, and value-for-money messaging, rather than flashy discounts or impulse-based promotions.
Prime Members cared about carbon emissions while shopping during Prime Day 2025
During Prime Day, Prime members in the U.S. opted to combine their deliveries for millions of orders, which saved about 10 million separate trips. This bundling of deliveries helped cut down on average carbon emissions.
Source: Amazon.
Sellers saw a 10x increase in Sales on Prime Day
Merchants who joined Prime Day saw a massive boost in sales, they had 10 times more sales with Prime orders daily and their revenue from these orders increased 8 times as compared to the month before Prime Day.
Source: Amazon.
Top-selling categories during Amazon Prime Day 2026
| Category | Share of Prime Members Shopping The Category |
| Apparel & Shoes | 30% |
| Household essentials (cleaning products, paper products, batteries, etc.) | 28% |
| Health & Wellness (vitamins, supplements, medicine, etc.) | 27% |
| Beauty or cosmetics | 26% |
| Home goods (bedding, décor, furniture, etc.) | 23% |
| Groceries | 16% |
| Pet products (food, treats, toys, etc.) | 16% |
| Consumer Electronics (TV, cell phone, electronic accessories, etc.) | 14% |
| Small appliances (coffee maker, blender, etc.) | 11% |
| Toys/Video Games | 11% |
Amazon Prime Day shopping trends in 2026 show that customers focused more on everyday needs, health, and personal care products compared to 2025. Apparel and shoes remained the most popular category, with 30% of Prime members buying products from this category, the same as last year.
Household essentials were also among the top purchases, with 28% of shoppers buying items like cleaning products, paper products, and batteries. However, fewer shoppers bought bigger-ticket items. Consumer electronics dropped from 18% in 2025 to 14% in 2026, while home goods like furniture, décor, and bedding fell from 26% to 23%.
On the other hand, health and wellness products saw a small increase, growing from 26% to 27%. Beauty and cosmetics also increased slightly, reaching 26% in 2026. Grocery purchases went up from 14% to 16%, showing that more shoppers used Prime Day deals for regular household items.
Overall, Prime Day 2026 shoppers appeared more focused on useful, everyday products rather than expensive purchases. Categories like essentials, wellness, and personal care gained more attention, while electronics and home products saw lower demand.
Source: Numerator
High-inflation categories sell the best during the Prime Day sale
Consumers use Amazon Prime Day as a way to save on products that have a high shelf price due to inflation. 26% of US Shoppers shopped at Prime Day to get relief from the inflated prices across categories like electronics and home goods.
14% of Consumers in the United Kingdom used Prime Day as a savings strategy against inflationary pressures, with an emerging trend of considering it a stock-up holiday for everyday essentials. In China, 20% of savvy shoppers used Prime Day as a savings strategy against rising inflation.
Source: Nielsen IQ.
78% of American households make purchases only on Amazon despite comparing prices across platforms
About 54% of shoppers said they looked at prices from different stores before buying something. But even after checking prices, most people still ended up buying from Amazon. Specifically, during retail events in July, 78% of shoppers bought their items exclusively from Amazon during the Prime Day week.
Source: Numerator
Factors discouraging people from shopping during Amazon Prime Day
Amazon Prime Day’s biggest motivating and discouraging factor is the same: Inflation!
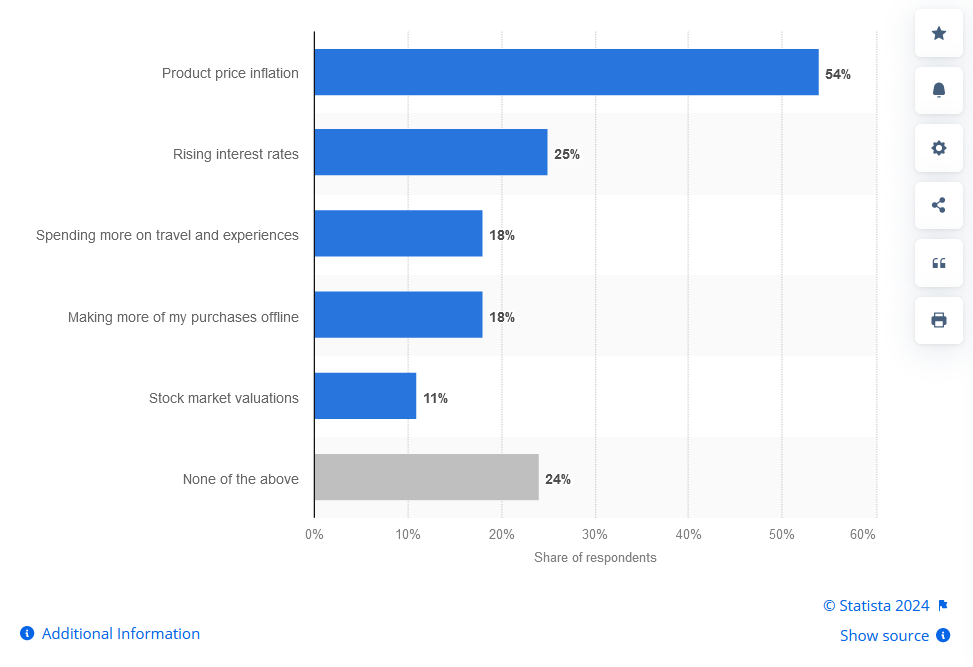
According to a Statista survey, 54% of consumers avoid shopping during Amazon Prime Day because of product price inflation, and 25% avoid it due to rising interest rates.
Here is a table showing factors discouraging people from shopping during Amazon Prime Day:
| Reason | Share of respondents |
| Product price inflation | 54% |
| Rising interest rates | 25% |
| Spending more on travel and experiences | 18% |
| Making more of my purchases offline | 18% |
| Stock market valuations | 11% |
| None of the above | 24% |
Source: Statista.
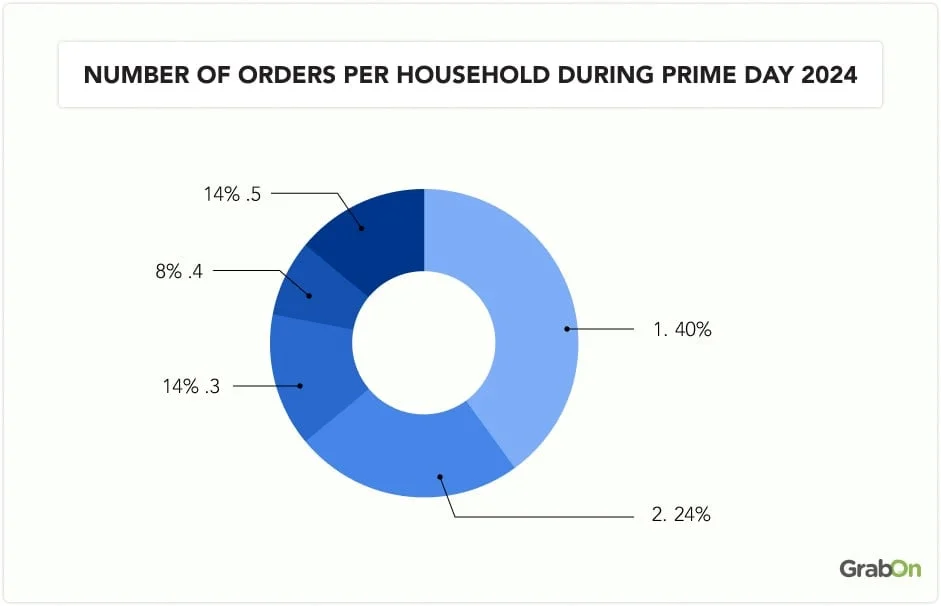
64% of households shopping on Prime Day placed two or more separate orders
6 out of 10 US households shopping during Amazon Prime Day 2025 placed at least 2 orders, bringing the average household spend to roughly $156.37.
37% of households shopped for only 1 item.
| Number of orders | Share of households |
| 1 | 37% |
| 2 | 23% |
| 3 | 14% |
| 4 | 9% |
| 5 | 18% |
Source: Numerator.
8 out of 10 Amazon Prime subscribers say they are members because of the free shipping feature
79% of Amazon subscribers say that they have subscribed to the membership to take advantage of the free shipping feature. 64% of non-Prime subscribers used their friend or family’s Prime account to order something to save the shipping costs.
79% of households spent less than $200 on Prime Day 2026
79% of households shopping at Amazon Prime Day 2026 spent less than $200, which 5.3% more households than the previous year.
| Average Spend | Share of Households |
| Less than or equal to $10 | 5% |
| Less than or equal to $20 | 9% |
| Less than or equal to $30 | 8% |
| Less than or equal to $40 | 8% |
| Less than or equal to $50 | 7% |
| Less than or equal to $100 | 22% |
| More than or equal to $200 | 20% |
| More than $200 | 21% |
61% of shoppers research products before buying them on Prime Day
Shoppers like to dig more into their products before they buy them on Prime Day. This involves reading user-generated reviews across platforms and consulting their friends and family. Many would also check the price history of the products and set a tracker to compare the prices on Prime Day.
Source: Statista.
People shop for millions of items using Amazon’s AI Rufus
Rufus, Amazon’s new AI-powered shopping assistant, helped millions of users shop during Prime Day deals Amazon’s wide selection with ease. Amazon’s Alexa also helped thousands of shoppers find the best deals during the sale period
With an influx of people using voice search to search for products every year, search queries will only continue to be more long-tail in nature as these types of searches tend to be comprised of 5 or more words.
If you wish to sell more on Amazon, optimize your product for voice search!
Source: Amazon.
Prime Day is a huge success for SMBs
Independent sellers on Amazon, mostly small and medium-sized businesses, sold over 200 million items during Prime Day 2024. SMBs on Amazon received 20 orders every second during the sale event.
Source: Amazon.
Buy now pay later spending reached $2 billion during Prime Day 2026
Amazon Prime Day 2026 saw U.S. shoppers embracing Buy Now, Pay Later (BNPL) options, which accounted for roughly 6.6% of all orders and about $2 billion in spending across the four-day event.
This shift highlights a growing trend of shoppers opting for flexible payment options to snag deals. Keep an eye on BNPL as it continues to reshape how people shop online.
Source: Statista.
50% of people get an Amazon Prime subscription for the sales.
Nearly 50% of U.S. shoppers subscribed to Amazon Prime to profit from Prime sales. About 20% of surveyed Prime users considered Prime Day a very important factor in their decision to subscribe to Amazon Prime.
Here is a table showing share of shoppers considering Prime Day important in their decision to be Amazon Prime subscribers:
| Not at all important | 26% |
| Slightly important | 25% |
| Important | 21% |
| Very important | 20% |
| The most important factor | 7% |
Source: Statista.
Amazon Prime Day shoppers compare product prices with other retailers before making a purchase
During Prime Day, 55% of shoppers took the extra step to compare prices at other retailers before finalizing their purchases on Amazon. Walmart was the top comparison destination, with 35% of shoppers checking prices there.
Following closely, 26% compared prices at Target, while 13% looked at Club retailers. Department stores Best Buy, eBay, and Temu also attracted comparison shoppers, with 10%, 9%, 5%, and 5%, respectively. Many also explored Amazon Promo Codes to stack additional discounts before completing their purchases.
Source: Numerator.
Additional Insights on Amazon Prime Day
- 88% of Prime Day shoppers said they were Amazon Prime members, and 85% among them have been Prime members for more than a year.
- 98% of Prime Day shoppers knew it was Prime Day before shopping for the event.
- 63% of Prime Day shoppers said they were extremely or very satisfied with the deals offered during Prime Day 2025. Only 3% said they were not at all happy about the deals.
Source: Numerator.
Frequently Asked Questions About Amazon Prime Day
What is the record for Amazon Prime Day sales?
Amazon Prime Days contributed a record-breaking $26.4 billion during in online shopping activities during the 2026 edition. People bought millions of items during the four-day sale period.
How much does Amazon sell on Prime Day?
Amazon sells around 12 million orders per day during Prime Day, but during sales events like Prime Day, Amazon can get even 100,000 orders per minute.
How many times a year is Prime Day sale?
Amazon Prime Day, launched in 2015, has become a major annual summer sale, usually held in mid-July and lasting two days. However, this year marked the longest-running Prime Day event yet, with the sale extending to four full days. In addition to the summer sale, Amazon also hosts Prime Big Deal Days every October, which is a separate two-day shopping event leading into the holiday season.
<a href=#Gen-X:-Value-Driven-and-Brand-Loyal>Gen X: Value-Driven and Brand-Loyal</p><p> <a href=#Boomers:-Conservative-but-Intent-Driven>Boomers: Conservative but Intent-Driven</p><li><a href=#Prime-Members-cared-about-carbon-emissions-while-shopping-during-Prime-Day-2025><b>Prime Members cared about carbon emissions while shopping during Prime Day 2025</b></li><li><a href=#Sellers-saw-a-10x-increase-in-Sales-on-Prime-Day><b>Sellers saw a 10x increase in Sales on Prime Day</b></li><li><a href=#Top-selling-categories-during-Amazon-Prime-Day-2026><b>Top-selling categories during Amazon Prime Day 2026</b></li><li><a href=#High-inflation-categories-sell-the-best-during-the-Prime-Day-sale><b>High-inflation categories sell the best during the Prime Day sale</b></li><li><a href=#78%-of-American-households-make-purchases-only-on-Amazon-despite-comparing-prices-across-platforms><b>78% of American households make purchases only on Amazon despite comparing prices across platforms</b></li><li><a href=#Factors-discouraging-people-from-shopping-during-Amazon-Prime-Day><b>Factors discouraging people from shopping during Amazon Prime Day</b></li><li><a href=#64%-of-households-shopping-on-Prime-Day-placed-two-or-more-separate-orders><b>64% of households shopping on Prime Day placed two or more separate orders</b></li><li><a href=#8-out-of-10-Amazon-Prime-subscribers-say-they-are-members-because-of-the-free-shipping-feature><b>8 out of 10 Amazon Prime subscribers say they are members because of the free shipping feature</b></li><li><a href=#79%-of-households-spent-less-than-$200-on-Prime-Day-2026><b>79% of households spent less than $200 on Prime Day 2026</b></li><li><a href=#61%-of-shoppers-research-products-before-buying-them-on-Prime-Day><b>61% of shoppers research products before buying them on Prime Day</b></li><li><a href=#People-shop-for-millions-of-items-using-Amazon’s-AI-Rufus><b>People shop for millions of items using Amazon’s AI Rufus</b></li><li><a href=#Prime-Day-is-a-huge-success-for-SMBs><b>Prime Day is a huge success for SMBs</b></li><li><a href=#Buy-now-pay-later-spending-reached-$2-billion-during-Prime-Day-2026><b>Buy now pay later spending reached $2 billion during Prime Day 2026</b></li><li><a href=#50%-of-people-get-an-Amazon-Prime-subscription-for-the-sales.><b>50% of people get an Amazon Prime subscription for the sales.</b></li><li><a href=#Amazon-Prime-Day-shoppers-compare-product-prices-with-other-retailers-before-making-a-purchase><b>Amazon Prime Day shoppers compare product prices with other retailers before making a purchase</b></li><li><a href=#Additional-Insights-on-Amazon-Prime-Day><b>Additional Insights on Amazon Prime Day</b></li><p> <a href=#Frequently-Asked-Questions-About-Amazon-Prime-Day>Frequently Asked Questions About Amazon Prime Day</p></ul></div>