Black Friday Statistics 2025: Shopping Trends & Sales Data
Holiday spending in the United States in 2025 is estimated to cross the trillion mark for the first time in history, and Black Friday sales will contribute a significant portion of it. According to Black Friday statistics, with 62% of Americans planning to shop during the Black Friday weekend, sales are estimated to reach $11.23 billion this year.
Know the demographics of shoppers and market trends of Black Friday for the 2025 season in this post.
Black Friday Statistics top picks
- Total Black Friday spending in the United States reached $40 billion in 2024.
- Online Black Friday spending in the US reached $10.80 billion in 2024. An increase of 10.71% from the previous year.
- 62% of the American population is planning to shop during the 2025 Black Friday sales.
- Nearly 15% of all retail sales in the United States occur between Black Friday and Christmas.
- 19% of shoppers start their holiday shopping from the Black Friday weekend.
- Mobile phones accounted for 54% of the total Black Friday sales in 2024.
Money spent on Black Friday Shopping over the years
Total Black Friday sales reached $40 billion in the US; online sales accounted for $10.80 billion. The sales are predicted to cross the $11.23 billion mark in 2025.
In 2023, Americans spent $9.80 billion during Black Friday, up by 7.45% from the previous year.
For the 2025 Black Friday weekend, spending is expected to reach $11.23 billion, exceeding the $10 billion mark for the first time in history.
Here is a table showing the Black Friday spending over the years:
| Year | Black Friday spending in the US |
| 2019 | $7.40 billion |
| 2020 | $9 billion |
| 2021 | $8.90 billion |
| 2022 | $9.12 billion |
| 2023 | $9.80 billion |
| 2024 | $10.80 billion |
| 2025* | $11.23 billion |
Source: Oberlo
62% of Americans are planning to shop during the Black Friday 2025 weekend
6 out of 10 Americans plan to shop during the 2025 black friday weekend. That is equivalent to 206 million people opening their wallets during the big holiday weekend.
If we take a look at the demographic data, then we get the following data 75% of Gen Z, 69% of millennials, and 62% of Gen X plan to shop during the 2025 black friday weekend.
In contrast, 44% of baby boomers have no plans to engage in holiday shopping events.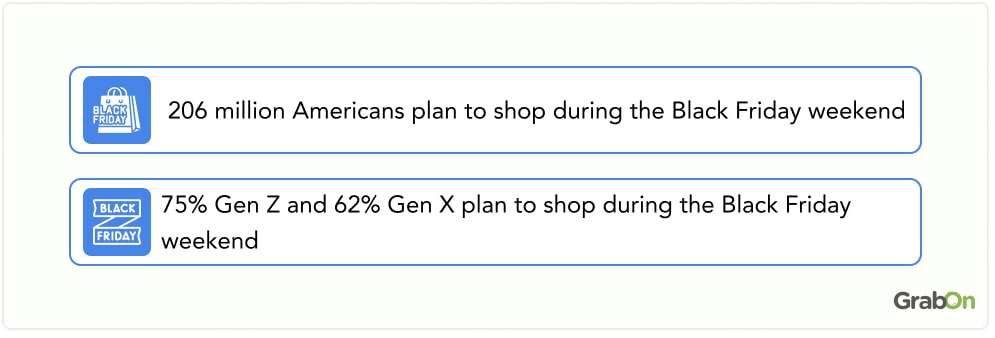
Source: Salsify.
General Black Friday Statistics
- Nearly 15% of all retail sales in the United States occur between Black Friday and Christmas.
- Key factors motivating shoppers in their purchase decisions include free shipping (49%), promotions (36%), an easy-to-use website and app (21%), and the buy-online-pick-up-in-store (BOPIS) option (20%).
- Consumers spent $397.64 on average during the last Black Friday. In 2024, the average spending per customer is estimated to reach $405.03.
- Consumers spent $397.64 on average during the last Black Friday. In 2025, the average spending per customer is estimated to reach $405.03.
- In-store shopping in the U.S. attracted 76.2 million visitors to physical retail locations during Black Friday.
Sources: Zippia, NRF, Statista, Queue.it
Statistics related to consumer behavior during Black Friday
- 19% of shoppers start their holiday shopping from the Black Friday weekend.
- 49% of Black Friday shoppers prefer a mix of online and in-store shopping
- 4 out of 10 American shoppers regret their Black Friday purchase.
- Electronics (25%) and Clothing (24%) are the most regretted Black Friday purchases among American shoppers.
- 35% of consumers plan their purchases in advance. Meanwhile, 15% never plan ahead, and 43% plan some of their purchases ahead of time.
- 78% of Black Friday shoppers are the most excited about electronic items going on sale. Household products and clothing are the second and third-most-awaited items on Black Friday.
- 61% of all shoppers will treat themselves while shopping for gifts.
- Millennials (73%) and Gen Zers (68%) are the most likely to indulge in self-spending. In contrast, baby boomers are the only group where most (53%) typically avoid buying something for themselves during the holiday shopping season.
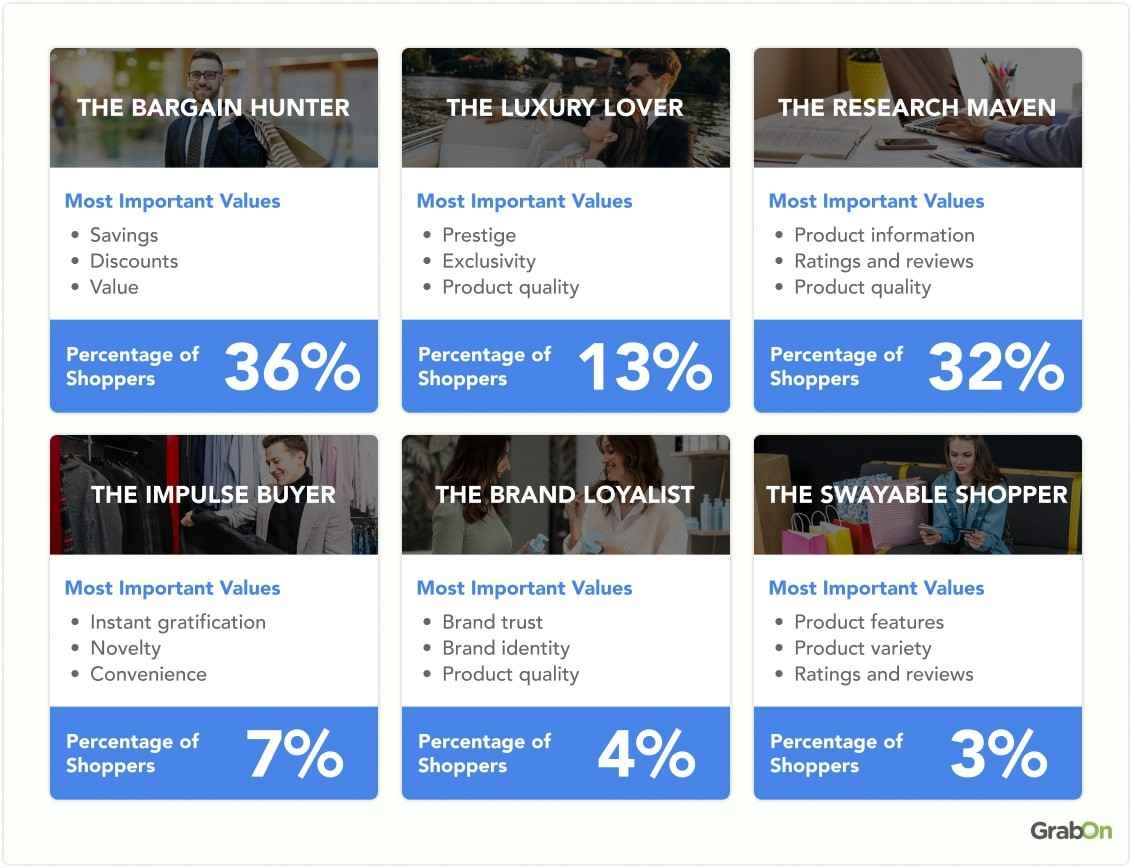
- Salsify decided to club shoppers in different categories based on their shopping habits, its report revealed that 36% of Black Friday shoppers were most keen about savings and discounts. 32% of shoppers fell in the category of researchers, the ones who carefully check to get the best product available.
- Three out of four holiday shoppers (75%) admit they’re enticed to buy gifts for themselves, though many say limited budgets might hold them back from self-gifting this season.
 Source: Self.inc, Salsify, Statista, Queue.it
Black Friday Shoppers Demographics
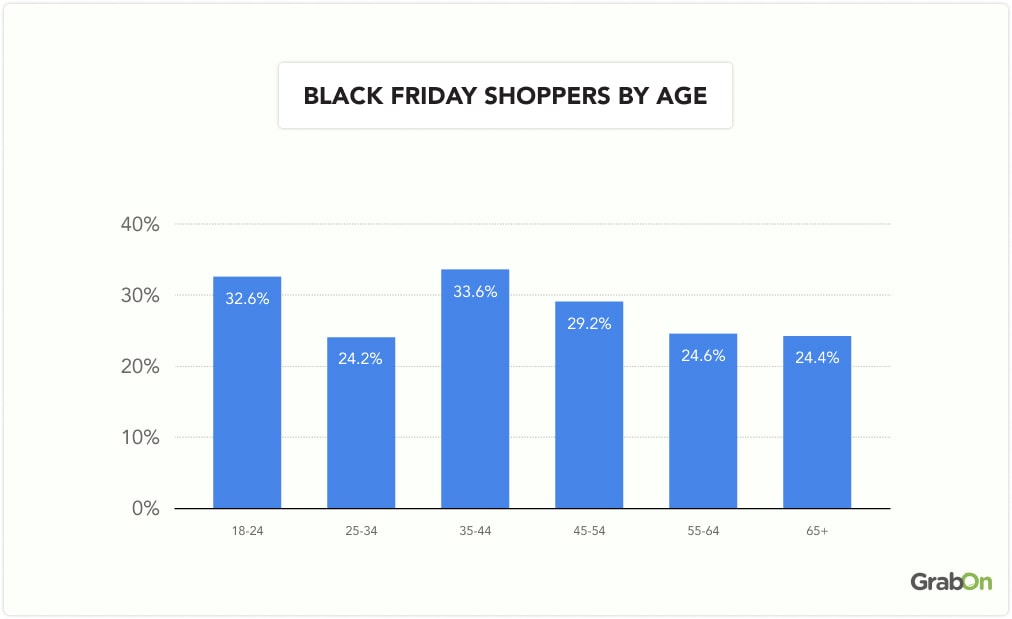
- People aged 18 to 34 make up over half of Black Friday shoppers, at 56.8%. The number of shoppers drops for older age groups, with those 65 and older making up only 24.4% of the total.
| Age Range | Percent |
| 18-24 | 32.6% |
| 25-34 | 24.2% |
| 35-44 | 33.6% |
| 45-54 | 29.2% |
| 55-64 | 24.6% |
| 65+ | 24.4% |
- Men are 8% more likely than women to plan their Black Friday purchases, with 40% of men planning ahead compared to 32% of women.
- Men (44%) are more likely to regret their Black Friday purchases than women (41%). If we break this stat down by category then we see that men regret buying electronic stuff the most while women regret the most on their beauty product purchases.
- Gen Zers (22%) and millennials (17%) are set to spend more this Black Friday compared to last year. In contrast, 26% of Gen Zers and 21% of baby boomers plan to cut back on their spending.
Black Friday Purchases (Men vs Women)
- Tech products are the top choice for men (65%) but less so for women (45%), and are declining in popularity among women.
- Clothing is the leading category for women (64%) and also significant for men (54%), although it has decreased in popularity among men.
- Gifts are more favored by women (57%) than men (36%), and their popularity is growing among women but declining among men.
- Accessories hold similar rankings for both genders (35% men, 43% women).
- Cosmetic/beauty products appear only in women's top five (40%) and are gaining popularity.
- Household appliances appear only in men's top five (23%).
Source: YouGov.
Leading reasons to shop during Black Friday
In 2023, the primary motivation for Black Friday purchases was buying Christmas presents for friends and loved ones, with 62% of consumers prioritizing these gifts. 43% of shoppers focused on necessary purchases such as food and clothing, while 42% were equally driven by gifts for friends and loved ones and spontaneous deal-grabbing.
Here is a table showing the Leading consumer reasons for shopping during the Black Friday:
| Reason | Share of shoppers |
| Christmas presents for friends and loved ones | 62% |
| Necessary purchases (food, clothing) | 43% |
| Gifts for friends and loved ones | 42% |
| Spontaneous deal-grabbing | 42% |
| Self-gifting | 36% |
| Essential purchases for the home | 35% |
| Birthdays and other gifting occasions | 26% |
| I won’t buy anything over Black Friday | 12% |
| No particular reason | 5% |
| Other | 1% |
Statistics on Black Friday discounts
- The average discount for Black Friday is 35%. Although there can be sales up to 80% off, most prices hover around the 35% mark. In-store discounts average about 20% off during the week of Thanksgiving and increase to around 37% on Thanksgiving and Black Friday. Online Black Friday deals offer an average discount of 34%.

- On Black Friday, 49% of shoppers believe jewelry has the best in-store discounts, with electronics close behind at 48%. Clothing is seen as the least discounted in-store item at 23%. Online, 77% of shoppers think clothing and shoes are the most discounted, while 71% feel video games have the best deals. Jewelry, though less favored online, is still considered the best discount by 51% of shoppers.
| Item Type | Has The Best Discount In-Store | Has The Best Discount Online |
| Clothing and shoes | 23% | 77% |
| Electronics | 48% | 52% |
| Jewelry | 49% | 51% |
| Video games | 28% | 71% |
| Home and kitchen | 46% | 53% |
| Beauty and personal care | 38% | 61% |
| Books and music | 40% | 59% |
Source: Zippia,
Black Friday Shopping Statistics by Device
- Mobile phones accounted for 54% of the total Black Friday sales in 2024. That is equivalent to $5.3 billion.
- Although smartphones capture the largest share of Black Friday shopping, they have the lowest average order value at $132.53. Tablets come next with an average order value of $155.16, which is 17.1% higher than smartphones. Desktops lead with the highest average order value at $184.07, 38.9% higher than smartphones and 18.6% higher than tablets.
- Another factor driving the increase in online Black Friday sales in 2023 was the rise in Buy Now Pay Later (BNPL) programs, which are now widely available through smartphone apps. In the week ending November 24, BNPL usage surged by 72% compared to the previous week.
Did you know? Americans spent $16 billion using BNPL during their 2023 holiday shopping.
Sources: Statista, Fast Company.
Black Friday Fraud Statistics
- 43 million Americans were scammed during the Black Friday 2024 weekend.
- 87% of US respondents are willing to share personal info, like their name or email, to get a gift, discount, or free service from retailers. Surprisingly, 89% of people who have experienced online shopping fraud would still share their details for a better deal.
- US online shoppers are most likely to share their email (54%) and name (51%). 5% would give up their credit card info, and 2% would share their Social Security number. Additionally, 12% would reveal their employer, and 4% would give out their children's names in return of offers.
Source: NordVPN.