64 Latest Ecommerce Statistics For Businesses (2025)
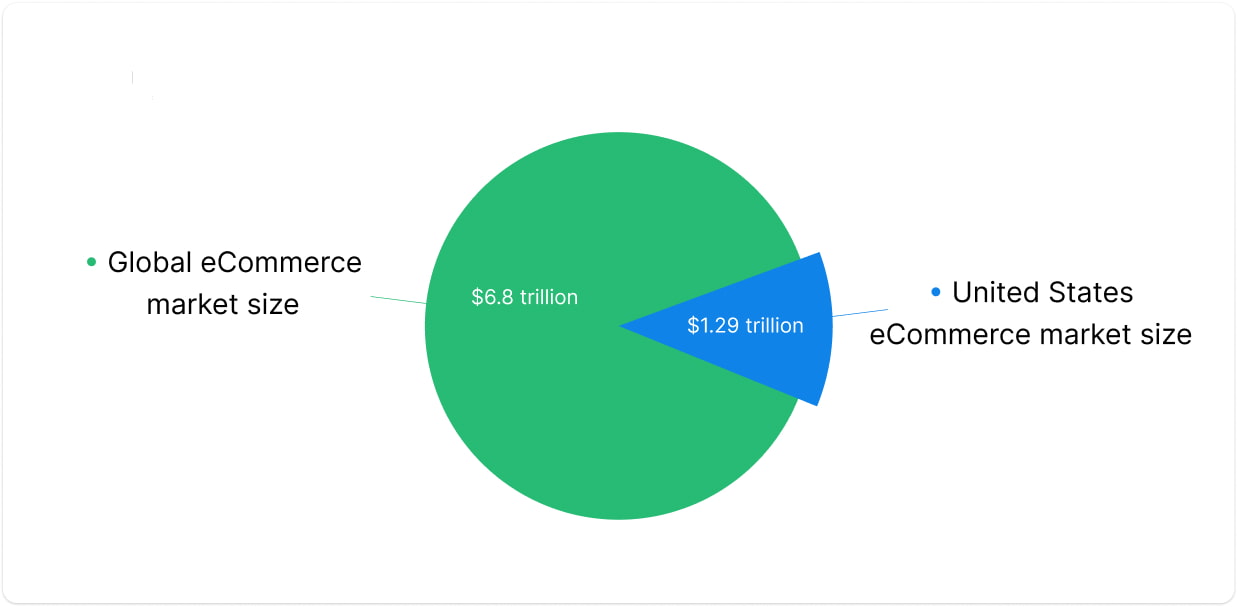
In eCommerce, guesswork no longer works. With the industry approaching a $6.8 trillion value, smart decisions depend on real data, not just instincts. Today, success means knowing what your customers are doing, why they’re doing it, and what trends are coming next.
We have carefully selected and listed 60+ powerful statistics that cover key parts of online shopping. Every insight is included to help you make better decisions, whether you're planning a campaign, improving user experience, or setting priorities for growth.
If you’re building strategies based on evidence, not assumptions, this is the data to guide you.
The ecommerce market size over the years
- The global ecommerce sales reached $6.33 trillion in 2024. The sales are estimated to grow at a CAGR of 7.8% and reach $6.8 trillion by the end of 2025 and $7.96 trillion by 2027.
- eCommerce sales in the United States reached $1.19 trillion in 2024, which is an 8.2% increase from 2023. Ecommerce sales in the country account for 16% of the total retail sales.
The ecommerce sales in the United States are predicted to reach $1.29 trillion by the end of 2025 and grow at a CAGR of 8.99% to reach $1.88 trillion by 2029.
- China is the largest eCommerce market globally with a valuation of $3.56 trillion. The ecommerce sales account for 47% of total retail sales in the country. China's ecommerce market size is projected to grow to $3.98 trillion by 2027.
- The global B2B ecommerce market is valued at $24.92 trillion in 2025. This valuation will reach $57 trillion by 2030.
Ecommerce revenue by region
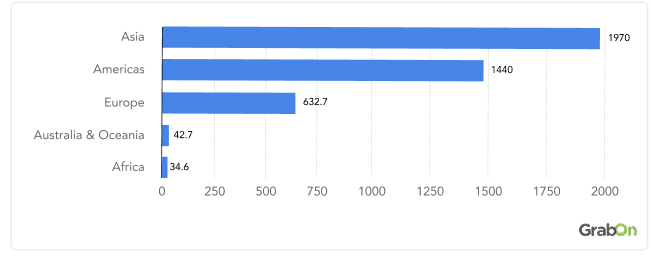
In 2024, Asia led the global e-commerce market, generating nearly $1.97 trillion in revenue. This accounted for 47.90% of the total global e-commerce revenue, with China playing a major role due to its massive online retail ecosystem.
Coming in second, the Americas generated around $1.44 trillion, which made up 34.86% of the global e-commerce share. The United States, in particular, was a key contributor to this figure thanks to strong consumer demand and advanced digital infrastructure.
Europe followed with $632.7 billion in revenue, accounting for 15.37% of global e-commerce. Countries like the United Kingdom, Germany, and France were among the top-performing markets in this region.
On the smaller end, Australia and Oceania generated $42.7 billion, which represented 1.04% of the global total. Meanwhile, Africa contributed $34.6 billion, making up just 0.84% of global e-commerce revenue. These regions are still growing in terms of digital adoption and infrastructure.
Together, these figures highlight the global distribution of e-commerce activity, with Asia remaining the clear leader and smaller regions showing room for future growth.
Ecommerce market growth in different countries
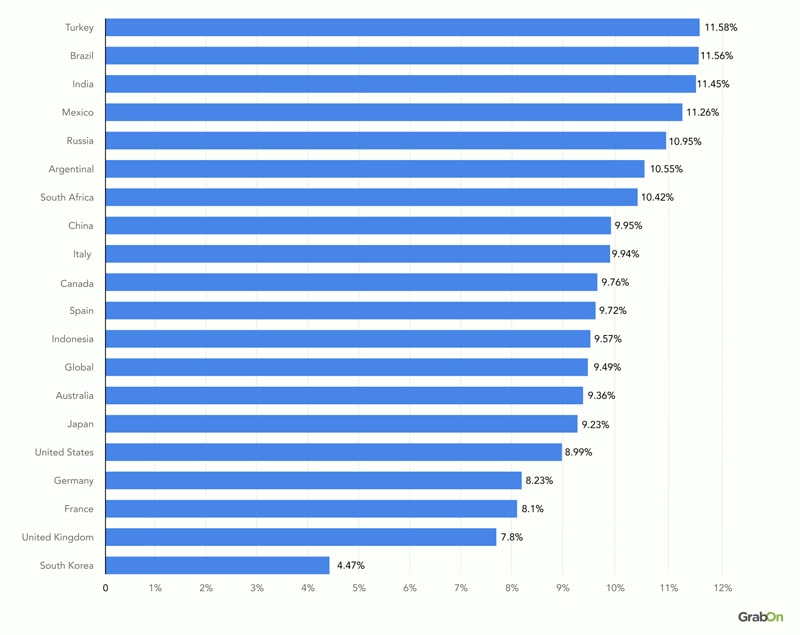
Turkey, Brazil and India are the three fastest growing eCommerce markets in the world. All the three nations are growing at a CAGR of 11.5%. The reason for this growth is increasing internet and smartphone penetration, a young and tech-savvy population, a rising middle class, and improving digital infrastructure.
The two biggest eCommerce markets in the world currently, the US and China, have an estimated CAGR of 8.99% and 9.95% till 2029.
Number of ecommerce shoppers globally
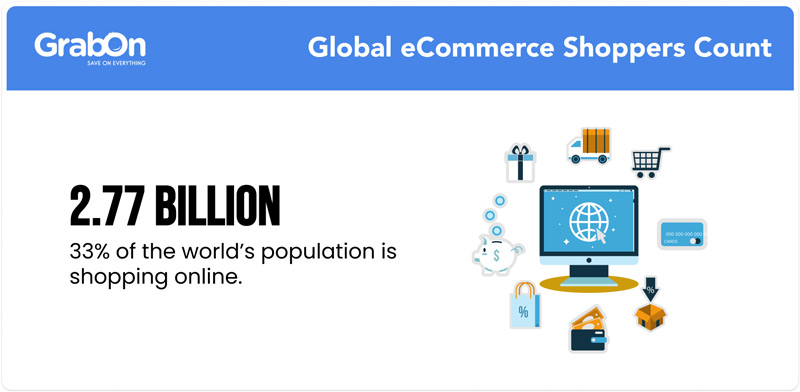
2.77 billion people around the world will shop online in 2025, a 2.2% increase from 2024, when around 2.70 billion people shopped online. This means that 33% of the world's population is shopping online this year. The number of online shoppers will increase to over 3 billion in 2026.
Ecommerce Shoppers By Country
| china | 915.1 million |
| USA | 270.11 million |
| India | 250 million |
| Brazil | 134 million |
| Japan | 94 million |
| Mexico | 74.1 million |
| Indonesia | 65 million |
| Germany | 62 million |
| UK | 57 million |
| France | 46.2 million |
| Turkey | 41 million |
| South korea | 38.2 million |
| Canada | 27 million |
Sources: JP Morgan, Statista, Oosga, International Trade Administration.
United States eCommerce demographics
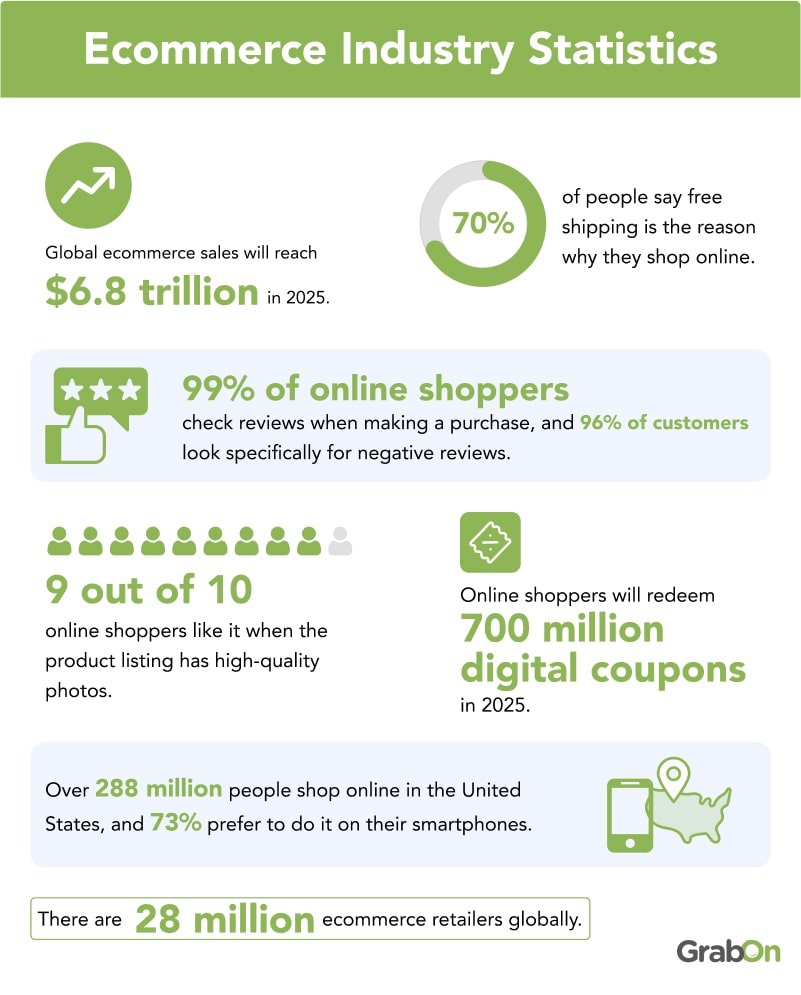
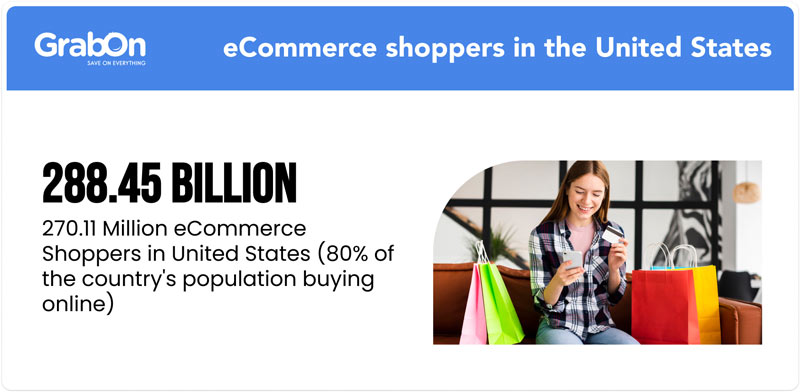
- It is estimated that there are around 288.4 million online buyers in the United States in 2025. This means over 80% of the country's population is buying stuff online.
- 73% of Americans prefer smartphones for online purchases. Laptops are the second most popular device with 43% votes. A considerable 11% of the US shoppers use smart speakers for online shopping.
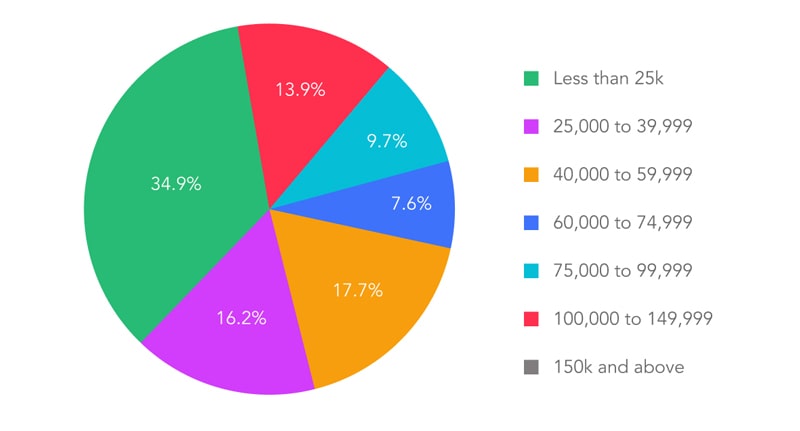
- 34.9% of online shoppers in the United States make less than $25,000. Another 33.9% had earned between $25,000 to $60,000.
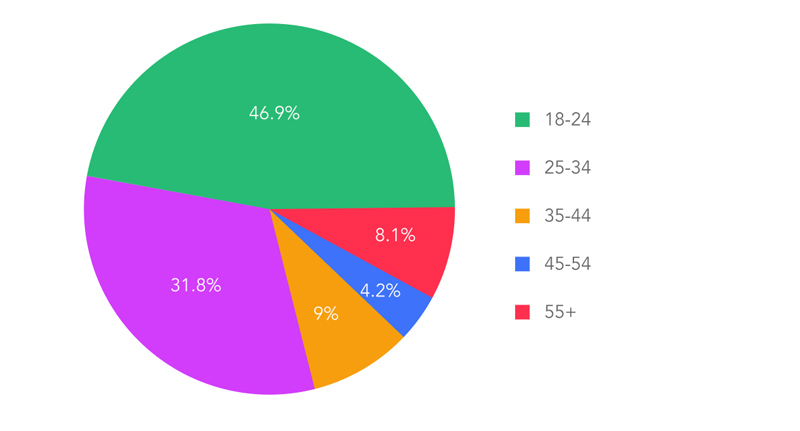
- 47% of US eCommerce shoppers are aged 18 to 24. The next largest age group, comprising 31.8% of shoppers, is the 25 to 34 age bracket. The percentage continues to decline as we progress, with only 13.2% of shoppers falling into the 34 to 54 age bracket.
Social commerce statistics
Social commerce is growing fast because people are spending more time on social media. As of 2024, 63% of the world population is on social media, and an average person now spends about 15% of their waking hours on social platforms. That adds up to around 2 hours and 26 minutes each day, using about 6 different apps.
- 113.2 million people in the United States will shop on social media in 2025. That’s an increase of 2.5% from the previous year when the number was 110.4 million.
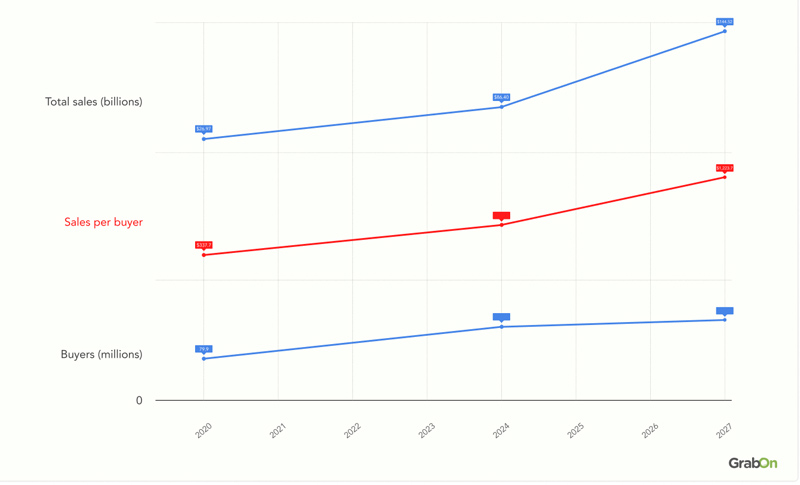
- Social commerce sales in the United States are estimated to surpass $90 billion in 2025. The average spending per shopper will be $776 during this period.
1/3rd of US shoppers in their early 20s begin the purchasing process through social media platforms.
Deals and coupons are the leading factor for people to shop via social media. Ease of purchase and more customer reviews are cited as important drivers, too. Coupon statistics reveal that shoppes will redeem 700 million digital coupons in 2025.
40% of United States social buyers are aged between 18 to 34. People aged between 34 to 44 make up 19.1%. This shows that people of all age groups enjoy shopping via social media and not just the younger generation.

- Facebook remains the top social media platform for social commerce in the United States. The platform has generated $164.5 billion in 2024. Following Facebook are YouTube ($31.5 billion) and TikTok ($23 billion).
Mobile commerce statistics
92% of US households in the United States have at least one smartphone and they account for 45% of the internet traffic in the country. On average, Americans spend about 4 hours and 25 minutes on their phones every day and check them around 144 times.
Although most of the time goes towards scrolling social media, a fair share of it also goes into shopping activities giving rise to mCommerce.
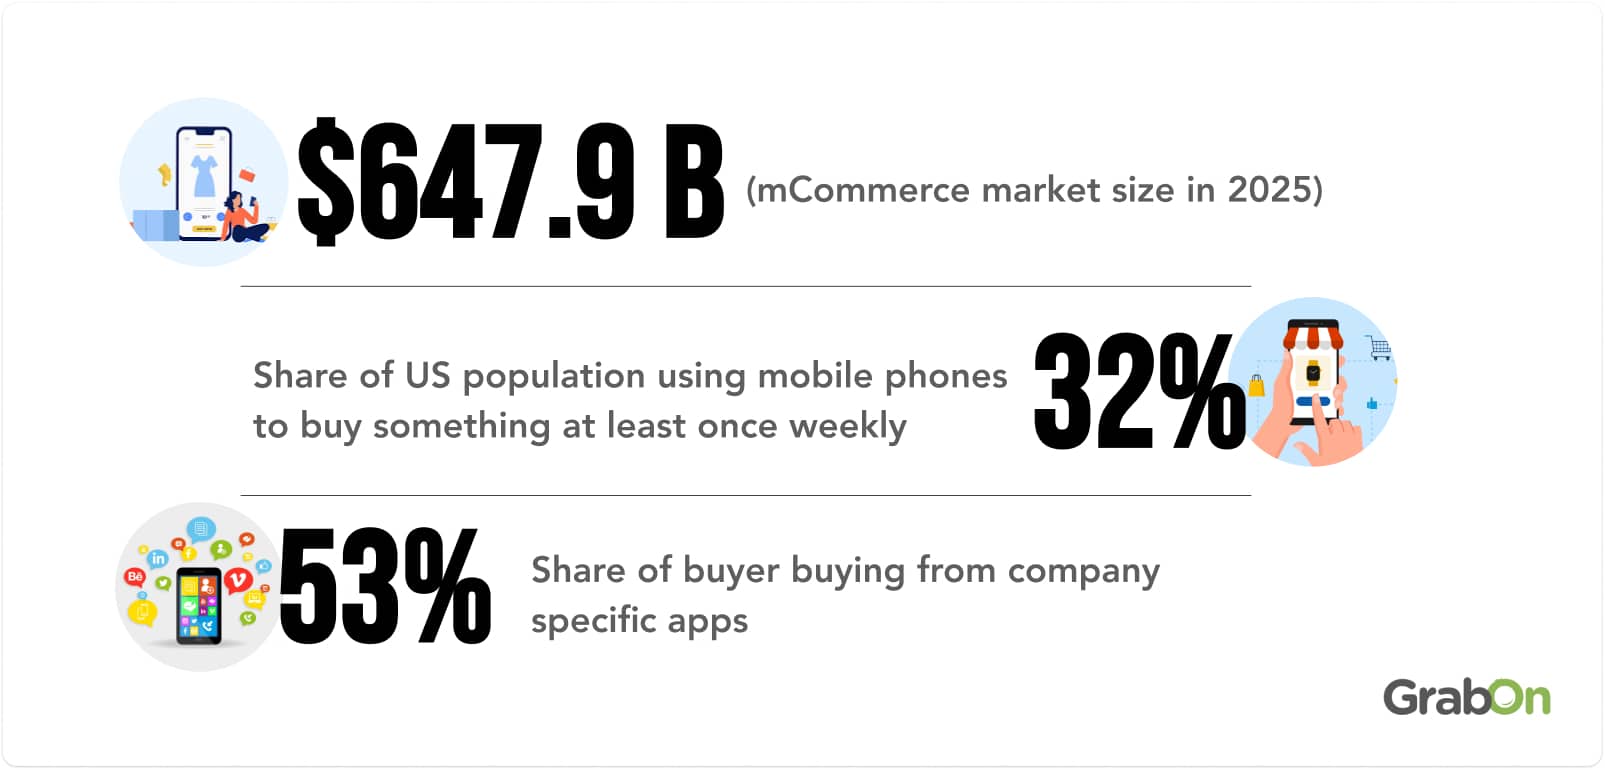
Mobile commerce sales will reach $647.9 billion in 2025 and $856.38 billion by 2027, growing at a CAGR of 14.9%.
45% of total ecommerce sales in the United States are made via smartphones.
76% of Americans have purchased something online using mobile phones in the past 12 months.
32% of the U.S. population uses their phone to buy something online at least once a week. The majority of the time they buy groceries and household supplies!
53% of smartphone users buy from company-specific apps.
Voice commerce, which is generally carried out through mobile phones, will account for over $40 billion in sales in 2025.
Ecommerce payment statistics
Convenience is the essence of eCommerce, and one of the biggest factors influencing online shoppers is their payment options. Credit cards and buy now pay later plans let people buy what they want even if they don't have all the money upfront.
But don't overlook the power of Cash on Delivery (COD) either. Offering COD as a payment option can actually lead to more orders because it gives customers an extra layer of confidence. Let’s explore statistics to see how different payment methods impact eCommerce.
Digital wallets account for almost half of the eCommerce transactions globally. Transactions worth $3.1 trillion were carried out via mobile wallets in 2023.
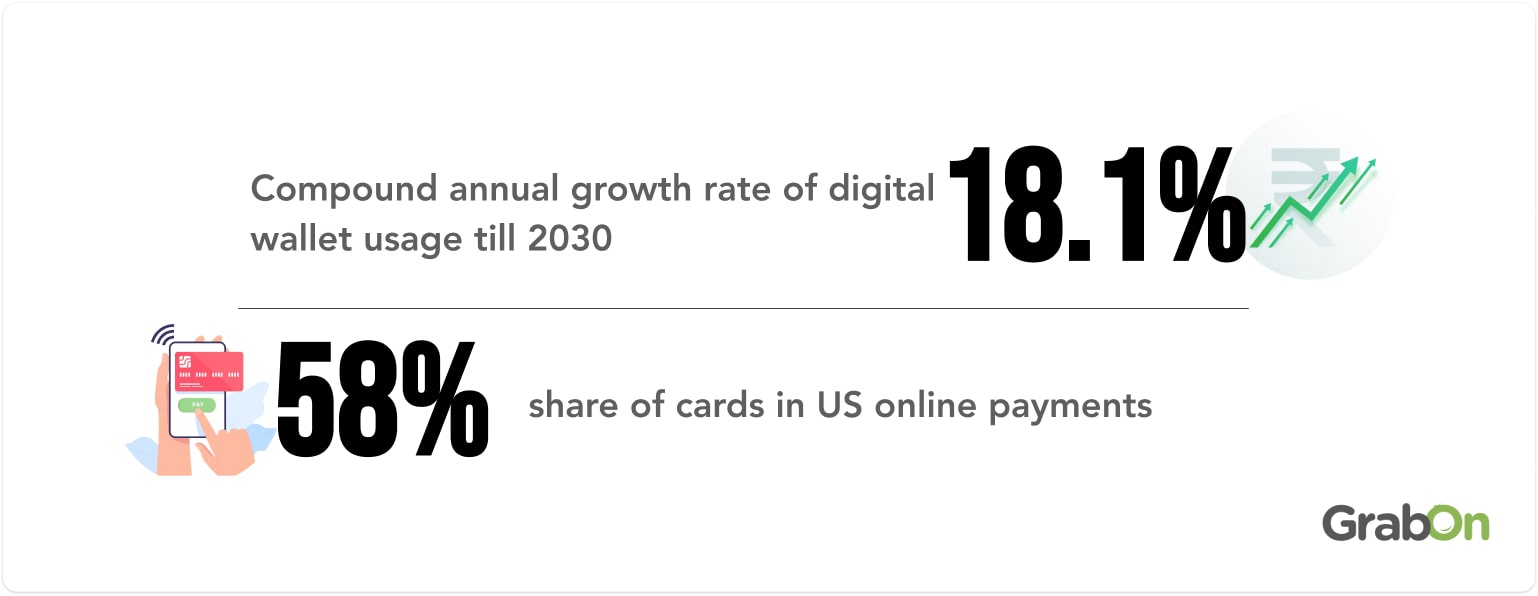
Digital wallet usage worldwide will grow at a CAGR of 18.1% from 2024 to 2030.
2 billion people globally use digital wallets for payments, with them being particularly popular in the Asia-Pacific region, where they account for over 70% of e-commerce payments.
Read our take on the growth of UPI usage in countries globally.
Cards account for 58% of online payments in the United States, while digital wallets make up 26%.
There are 3.26 credit cards per capita, compared with just 0.99 debit cards in the United States.
Buy Now Pay Later transactions are estimated to be valued at $144.9 billion in 2025, up by 8.9% from the previous year. This value will reach $205.76 billion by 2029.
e-commerce losses to online payment fraud accounted for $48 billion in 2023. Up by 17% from the previous year.
13% of online shoppers will abandon their carts if they don't find their preferred payment options at checkout
Ecommerce social proof statistics
Social proof is like getting a thumbs-up from friends before you buy something online, making it feel more trustworthy and less like a gamble. Social proof helps people make better decisions and feel more connected to the brands they choose.
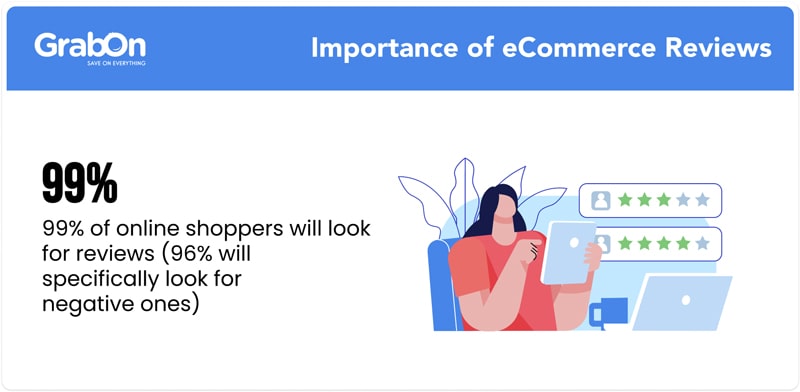
99% of online shoppers check reviews when making a purchase, 96% of customers look specifically for negative reviews.
An item with one review is 65% more likely to be purchased than an item with no reviews.
The average consumer needs to read 10 reviews before they trust a business.
49% of shoppers trust customer reviews as much as personal recommendations from family and friends.
Social proofs are also one of the leading reasons for the rise of social commerce as 71% shoppers are more likely to make a purchase based on referrals they've seen on social media platforms.
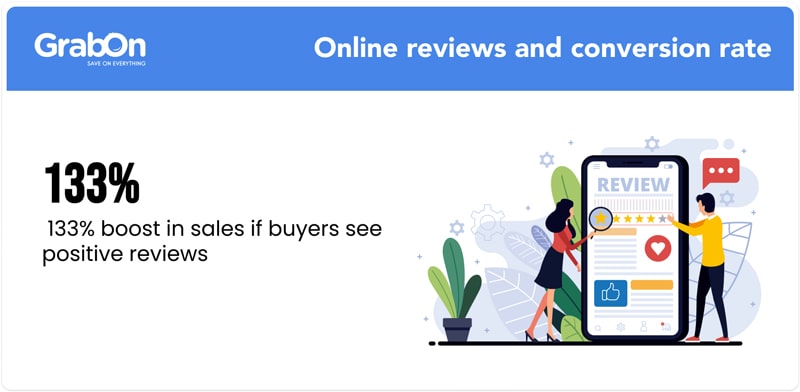
Online conversions increase 133% when mobile shoppers see positive reviews before buying, and 54% of people have purchased a consumer packaged goods after seeing visual user generated content showing it.
69% of people trust recommendations from their favorite influencers. Brands see a big payoff from this trust too, as every dollar spent on influencer marketing brings in about $5.78.
Ecommerce shipping statistics
70% of people say free shipping is the reason why they shop online. 62% of them say it's so important to them that they won't make a purchase without it.
42% of all eCommerce transactions in the U.S. include free shipping.
Online consumers are six times more likely to value free shipping over fast shipping.
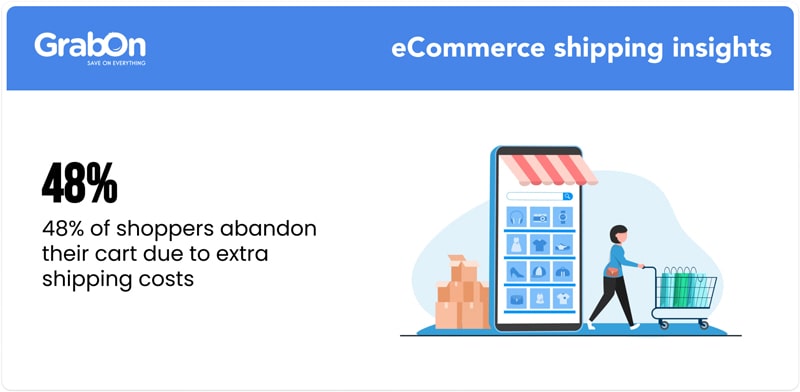
Shipping and other charges are the leading cause of cart abandonment; 48% of consumers will abandon their cart at checkout due to extra shipping costs.
45% of people say free return shipping is the most important factor when buying online, and about 24% value how easy it is to return items. Free return shipping is as important as free shipping, with 84% of shoppers checking the return policy before buying.
Ecommerce Cart Abandonment Statistics
- 70.19% of all online shopping carts are abandoned by shoppers globally.
- 48% of global shoppers abandon their carts due to additional charges at final checkout (shipping, tax).
| Shopping Cart Abandonment Reasons | Share Of Shoppers |
| Additional charges at final checkout (shipping, tax) | 48% |
| Mandatory account creation before checkout | 26% |
| Lack of trust on the site with credit card information | 25% |
| Slow delivery speed | 23% |
| Long or complicated checkout process | 22% |
| I couldn't see/calculate the total order cost up-front | 21% |
| Unsatisfactory returns policy | 18% |
| The website crashed during checkout | 17% |
| Not enough payment methods | 13% |
| The credit card was declined | 9% |
- Shopping cart abandonment is highest on mobile phones at 75.5%, which is 5.31% above the global average, and lowest on tablets with 68.5%.
- Cart abandonment rate by age group.
| Shoppers Age Group | Abandonment Rate |
| 25 to 34 | 21% |
| 35 to 44 | 20% |
| 45 to 54 | 13% |
Ecommerce website and SEO statistics
There are 28 million e-commerce websites out there, and everyone wants to stand out. While ranking high in search results is crucial, having a great design and user experience (UI/UX) is just as important. A well-designed e-commerce site can make a huge difference in your business’s success.
Let's dive into some interesting statistics related to e-commerce websites.
9 out of 10 online shoppers consider high-quality product photos as one of the most important factors while purchasing.
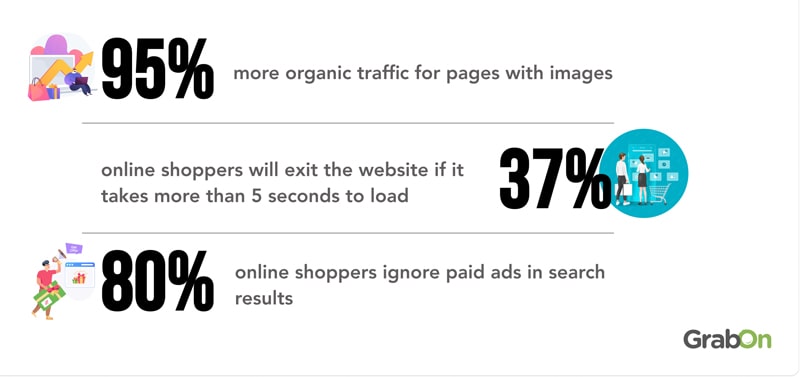
Product pages with photos attract 95% more organic traffic than pages without images.
50% of users prefer products with detailed descriptions over those with less information.
42% of consumers said they will leave a website because of poor functionality.
Mobile-friendly websites can increase the likelihood of purchase by 67%.
Ecommerce sites with a blog have 434% more indexed pages than those without.
37% of online shoppers will abandon a site if it takes more than 5 seconds to load
80% of users ignore paid ads in search results.

