Uber Statistics USA in 2026: Active Users, Drivers, & Revenue
Uber has been dominating the largest cab booking brands worldwide since its establishment in 2009. Currently, it has over 180 million monthly platform consumers (MAPCs) across 17,000 cities in 70 countries.
In addition to its cab service, Uber has expanded its business into freight and food delivery services. In Q2 2025, Uber reported total revenue of approximately $12.7 billion. Its Mobility segment contributed $7.2 billion, Delivery generated $4.1 billion, and Freight brought in $1.26 billion.
Uber has a global network of over 8.8 million drivers, completing more than 3.3 billion trips globally.
Let’s do a detailed analysis of Uber using numerical data.
Top Uber Statistics in 2025 (Editor's Pick)
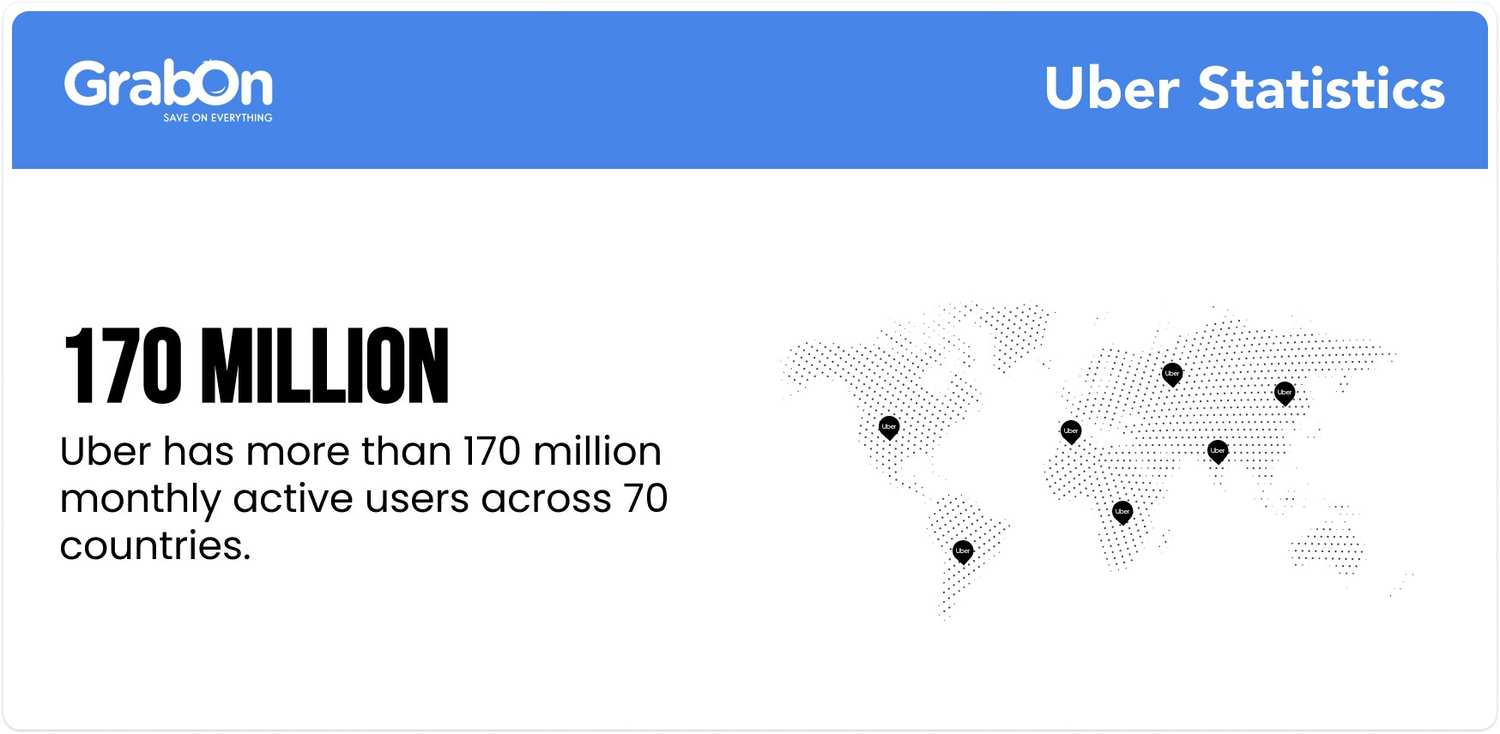
- Uber has more than 180 million MAPCs (Monthly Active Platform Consumers) globally across 70 countries as of June 2025.
- As of Quarter 2 2025, it has employed over 8.8 million drivers worldwide.
- Uber recorded over 3.3 billion trips globally and 36 million trips per day for Q2 2025.
- The platform has about 52% male and 48% female users as of 2025.
- Uber has a market share of over 76% in the U.S. ridesharing industry.
- Uber reported a revenue of $12.7 billion in Q2 2025 and an annual revenue of $43.9 billion in 2024.
How many people will use Uber in 2025?
As of 2025, Uber serves over 180 million monthly active platform consumers across 70 countries through its various platforms, including Rides, Eats, Freight, and more. This is a 15% growth YoY and a monthly trips per MAPC growth of 2% YoY.
Uber’s monthly active user count is expected to exceed 200 million by the end of 2028.
In Quarter 2 of 2025, the platform had around 156 million monthly active platform consumers (MAPCs) worldwide.
The table below shows the Uber monthly active user count by quarter:
| Year and Quarter | MAU (Millions) |
| 2022 Q1 | 115 million |
| 2022 Q2 | 122 million |
| 2022 Q3 | 124 million |
| 2022 Q4 | 131 million |
| 2023 Q1 | 130 million |
| 2023 Q2 | 137 million |
| 2023 Q3 | 142 million |
| 2023 Q4 | 150 million |
| 2024 Q1 | 149 million |
| 2024 Q2 | 156 million |
| 2024 Q3 | 161 million |
| 2024 Q4 | 165 million |
| 2025 Q1 | 170 million |
| 2025 Q2 | 180 million |
| 2025 Q3 | 177 million* |
| 2025 Q4 | 183 million* |
*Data from 2026 onward is projected based on current growth trends.
Source: Uber Investor, Business of Apps, Uber Investor Results Q2 2025
How many Uber users are there in the United States?
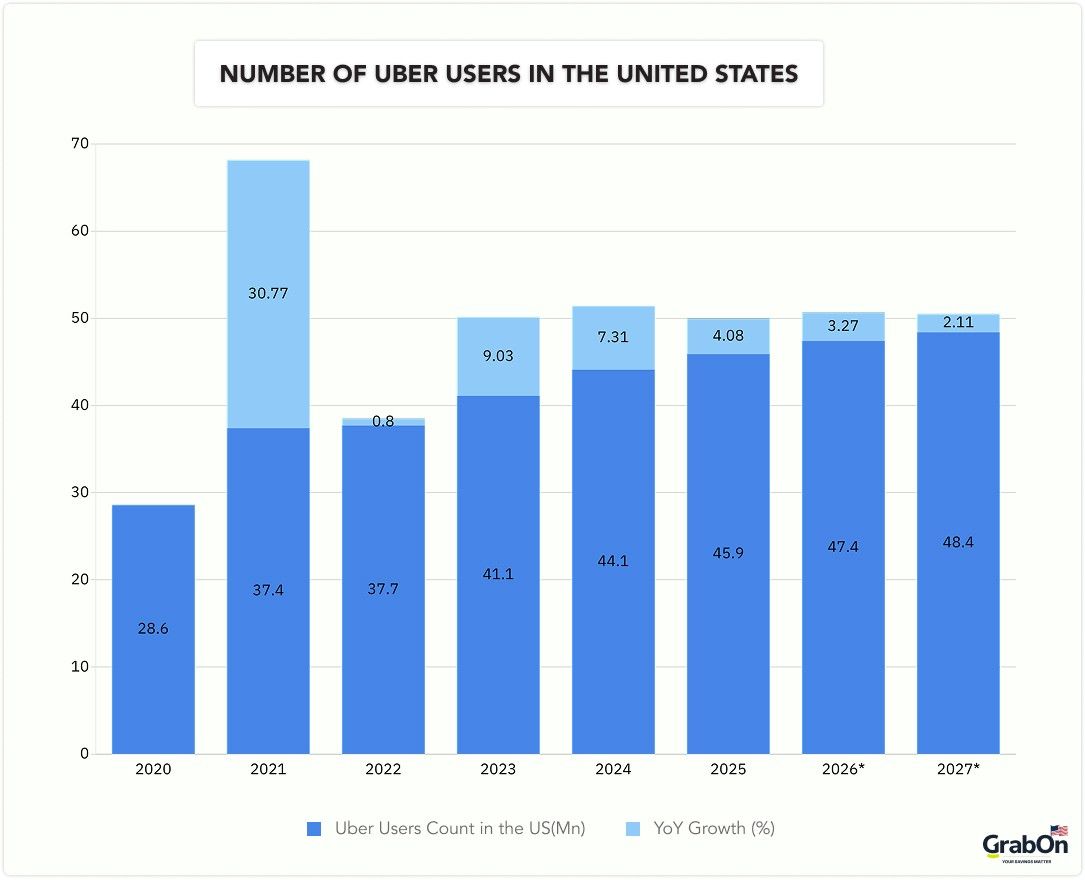
Uber has over 45.9 million users in the United States as of 2025, a 4.08% increase from 44.1 million in 2024.
The average year-on-year user growth rate of Uber in the US is around 10.4% from 2021 to 2025.
Uber is projected to have 50 million users in the United States by the end of 2028.
Here is the breakdown of the total number of Uber users in the United States:
| Year | Uber Users Count in the US | YoY Growth (%) |
| 2020 | 28.6 million | |
| 2021 | 37.4 million | + 30.77% |
| 2022 | 37.7 million | + 0.80% |
| 2023 | 41.1 million | + 9.03% |
| 2024 | 44.1 million | + 7.31% |
| 2025 | 45.9 million | + 4.08% |
| 2026* | 47.4 million* | + 3.27%* |
| 2027* | 48.4 million* | + 2.11%* |
*Data from 2026 onward is projected based on current growth trends.
Source: eMarketer
How many Uber drivers are there worldwide?
As of Q2 2025, over 8.8 million active drivers and couriers are working with Uber worldwide. This is about an 18.92% increase from 7.4 million in Q2 2024.
Since 2023, Uber has employed an average of 7 million drivers and couriers per quarter. The Q1 2025 data is the highest figure, showcasing the brand's strong global earnings base.
The table below shows the breakdown of the number of Uber drivers and couriers per quarter:
| Quarter | Number of Uber Drivers and Couriers |
| Q1 2023 | 5.7 million |
| Q2 2023 | 6.0 million |
| Q3 2023 | 6.5 million |
| Q4 2023 | 6.8 million |
| Q1 2024 | 7.1 million |
| Q2 2024 | 7.4 million |
| Q3 2024 | 7.8 million |
| Q4 2024 | – |
| Q1 2025 | 8.5 million |
| Q2 2025 | 8.8 million |
| Q3 2025* | 9.4 million* |
| Q4 2025* | 9.8 million* |
*Data from Q2 2025 onward is projected based on current growth trends.
Source: Uber Investor, Backlinko
How much does an Uber driver make?
An Uber driver generally earns an average of $20 to $30 per hour. This translates to:
- $600 to $1,000 per week
- $2,700 to $3,300 per month
These figures do not include additional expenses such as gas, maintenance, and insurance.
The earnings of an Uber driver and courier can vary depending on the location, timing, and additional costs.
West Virginia, Wyoming, Kentucky, and Indiana are the top four states in the United States where an Uber driver's average salary is the highest. Here is the complete breakdown of how much an Uber driver can make in these four states:
| Time Frame | The average salary of an Uber driver |
| Per Hour | $28.38 to $30.95 |
| Per Week | $1,079 to $1,176 |
| Per Month | $4,674 to $5,096 |
| Per Year | $56,088 to $61,148 |
Hawaii, Idaho, and Florida are the three states in the U.S. where the average salary of an Uber driver is low. Here is the complete breakdown of their salary in various time frames:
| Time Frame | The average salary of an Uber driver |
| Per Hour | $21.42 to $21.89 |
| Per Week | $814 to $832 |
| Per Month | $3,527 to $3,604 |
| Per Year | $42,323 to $43,250 |
Source: Talent.com, Salary.com
What is the gender pay gap among Uber drivers?
According to a survey by Stanford University, American male Uber driver earns on average $21.28/hour, compared to $20.04/hour for women.
This represents a gap of approximately $1.24 per hour, indicating a 6.2% difference between men and women.
Men drivers also earn more weekly compared to women, it’s $397.68 per week vs. $268.18 per week, respectively. This pay gap is primarily due to more hours and trips per week.
Male Uber drivers work about 17.98 hours per week, while female drivers work around 12.82 hours per week.
Here is the breakdown for Male vs. Female Uber drivers’ average salary differences:
| Metric | Men | Women |
| Average weekly earnings | $397.68 | $268.18 |
| Average hourly earnings | $21.28 | $20.04 |
| Average hours worked/week | 17.98 hours | 12.82 hours |
| Average trips/week | 31.52 | 21.83 |
Sources: Stanford University
Total Number of Uber Trips
In Q2 2025, Uber had completed over 3.3 billion trips worldwide, reflecting an 18% YoY increase.
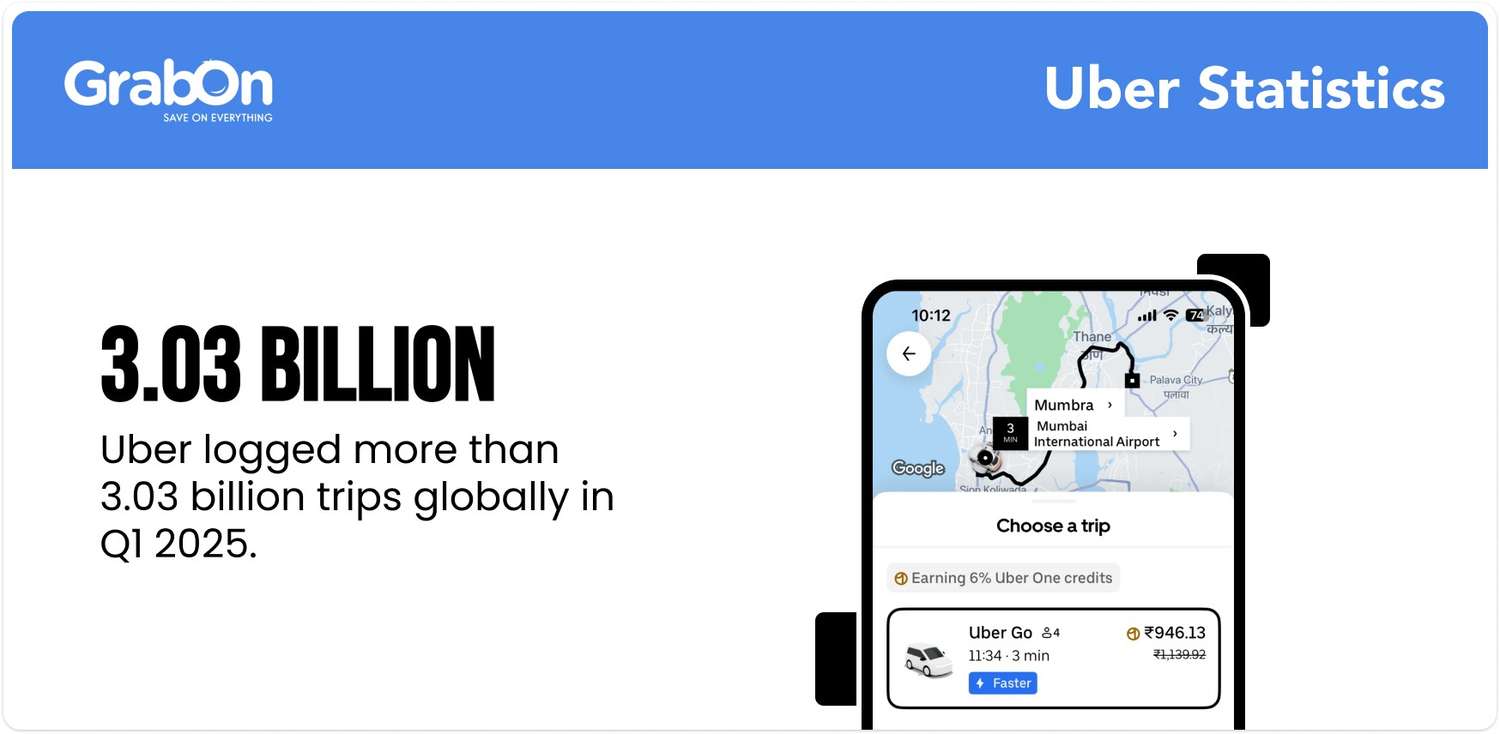
According to Uber, it currently logs over 36 million trips daily. The company handled over 11.23 billion trips in 2024.
Here is the table to showcase the number of trips Uber handles every year:
| Year | Number of Uber Trips |
| 2021 | 6.36 billion |
| 2022 | 7.64 billion |
| 2023 | 9.44 billion |
| 2024 | 11.23 billion |
| 2025 (Quarter 2) | 3.3 billion |
Source: Uber Investor
Uber User Demographics
Uber is one of the few global platforms with a nearly equal ratio of male and female users, making it a gender-balanced service used widely by both men and women. However, it is mostly used by millennials and those who fall in the middle 50% income group. It is equally used by users from the urban and suburban areas. Here are more interesting Uber user demographics statistics:
Uber Users by Gender
As of 2025, 52% of Uber users globally are male and 48% are female. The gap between male and female users is very minute and will be on par in the future.
Uber regularly introduces safety features for women, helping build trust and encouraging more female users to choose the platform. This ongoing focus on safety has contributed to a steady rise in its female user base.
Here is the complete breakdown of Uber users by gender statistics:
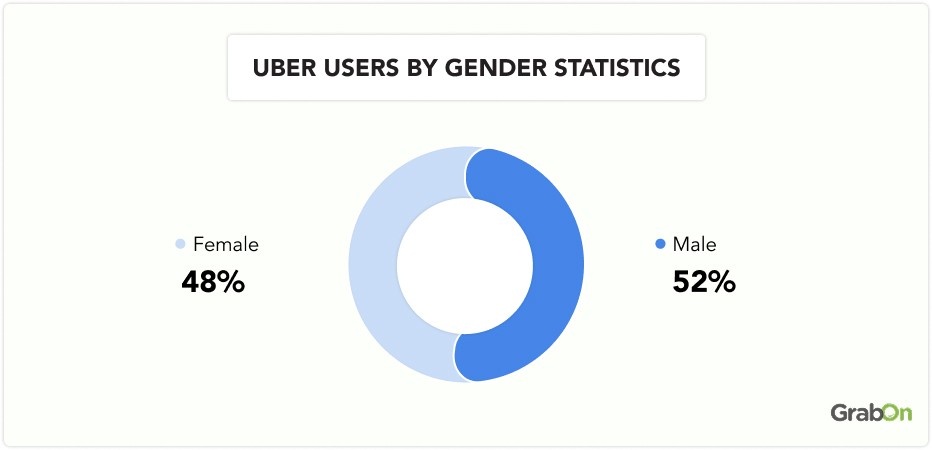
| Male | Female |
| 52% | 48% |
Source: GWI, SimilarWeb
Uber Users by Age
About 44.87% of Uber users are under the age of 35, with millennials making up the largest segment at nearly 28.96%. This highlights Uber's strong appeal among younger, tech-savvy commuters.
Users aged 35 to 44 contribute approximately 20.52%, ranking second to millennials.
The table below shows the detailed breakdown of Uber users’ statistics by age groups:
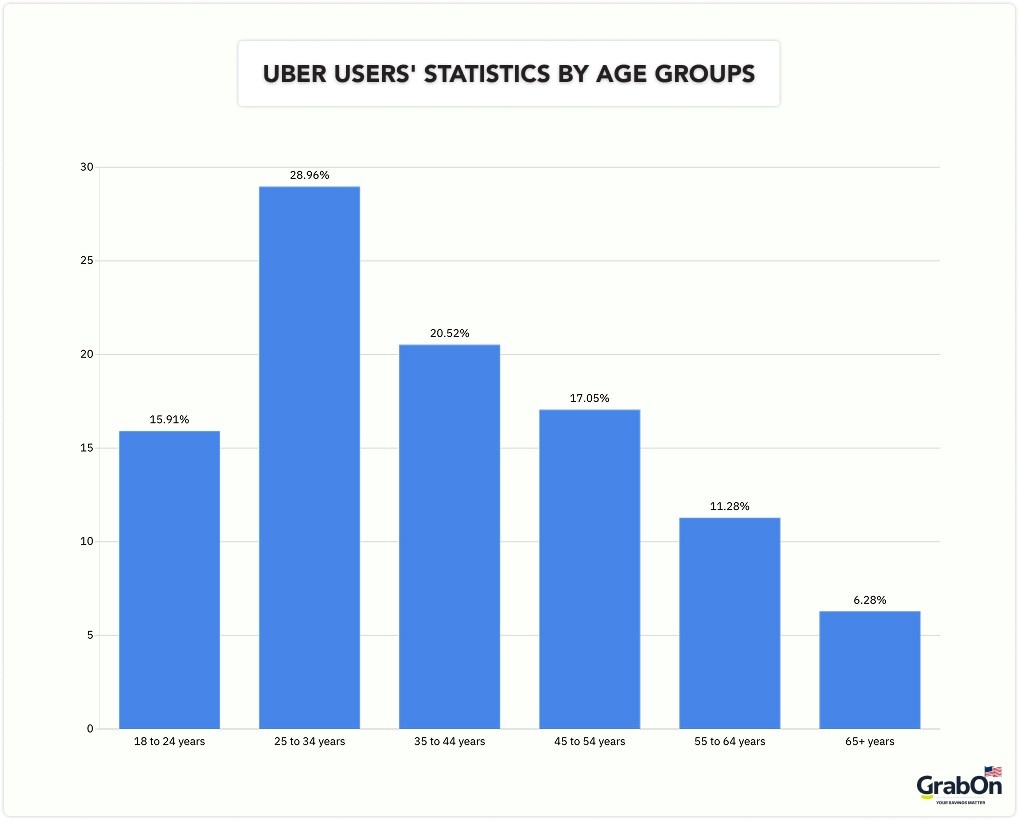
| Age Groups | Share of Uber Users |
| 18 to 24 years | 15.91% |
| 25 to 34 years | 28.96% |
| 35 to 44 years | 20.52% |
| 45 to 54 years | 17.05% |
| 55 to 64 years | 11.28% |
| 65+ years | 6.28% |
Source: SimilarWeb
Uber Users by Income
Around 44% of Uber users belong to the middle 50% income group, while 27% come from the top 25% income bracket.
The remaining 22% of Uber users are from the bottom 25% income segment.
Here is the detailed breakdown of Uber users by income brackets:
| Income Segment | Share of Uber Users |
| Top 25% | 27% |
| Middle 50% | 44% |
| Bottom 25% | 22% |
| Prefer not to say | 7% |
Source: GWI
Uber Users by Urban Context
Almost 46% of Uber users are from urban areas, and around 48% live in suburban regions. This indicates that Uber has a strong presence in both cities and suburbs.
Only 6% of users are from rural locations, highlighting limited usage in those regions.
The table below provides a complete breakdown of Uber users’ statistics by urban context:
| Urban Context | Share of Uber Users |
| Urban | 46% |
| Suburban | 48% |
| Rural | 6% |
Source: GWI
Uber Booking Statistics
As of Q2 2025, Uber’s gross bookings amounted to over $46.8 billion, a 17% YoY or 18% on a constant currency basis. $4 billion increase from $42.8 billion in Q1 2025.
The brand's annualized gross bookings amounted to over $162.5 billion in 2024 and $137.7 billion in 2023. Uber's annual gross bookings are expected to surpass $170 billion in 2025.
Here is the annualized gross bookings data of Uber from 2021:
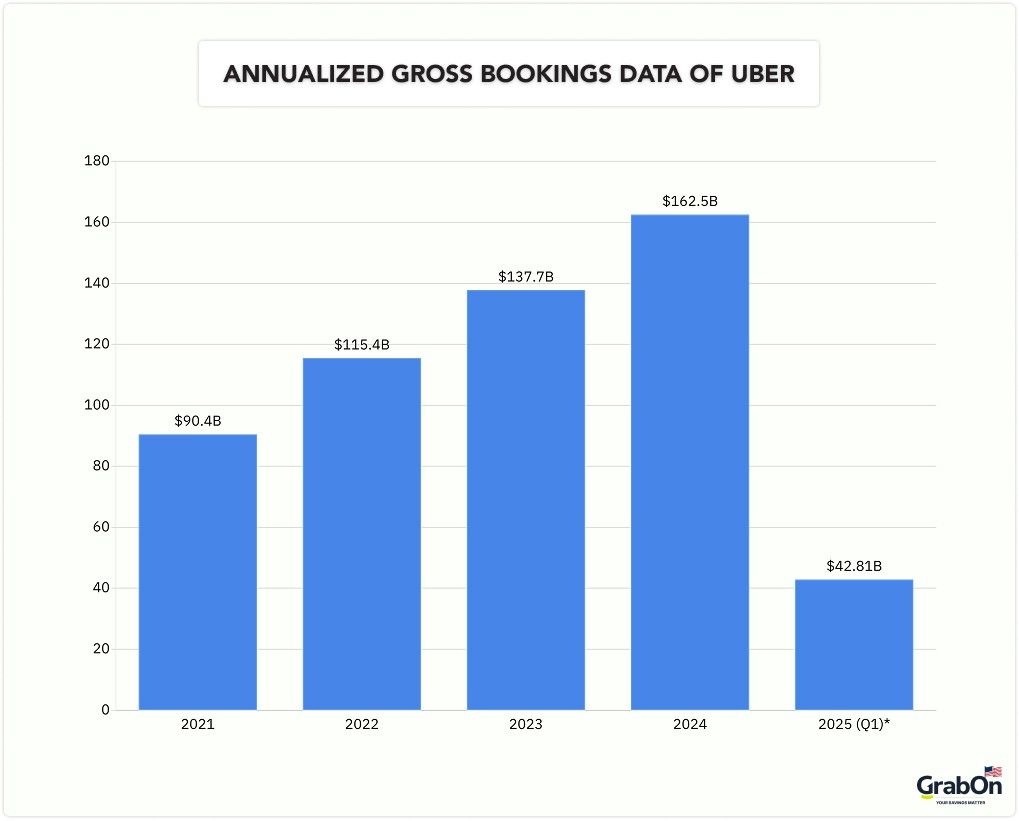
| Year | Annualized Gross Booking of Uber |
| 2021 | $90.4 billion |
| 2022 | $115.4 billion |
| 2023 | $137.7 billion |
| 2024 | $162.5 billion |
| 2025 (Q2) | $46.8 billion (Q2) |
Source: Uber Investor
Uber Ridesharing Statistics (U.S. Market)
The global ridesharing market size was about $123.08 billion in 2024, a 15.46% increase from $106.6 billion in 2023. Uber dominates the ridesharing industry globally. Here are some intriguing ridesharing statistics you must know:
Uber's Share of the US Rideshare Market
As of 2024, Uber dominates the U.S. ridesharing market with more than 76% share, while Lyft follows with around 24%. This demonstrates Uber's domination in the industry, ahead of its main competitor.
Uber held a 74% market share in 2023, rising from 68% in 2021. The dip in 2021 was largely due to the impact of COVID-19 on ride demand.
Here is the data about the ridesharing market size of the United States:
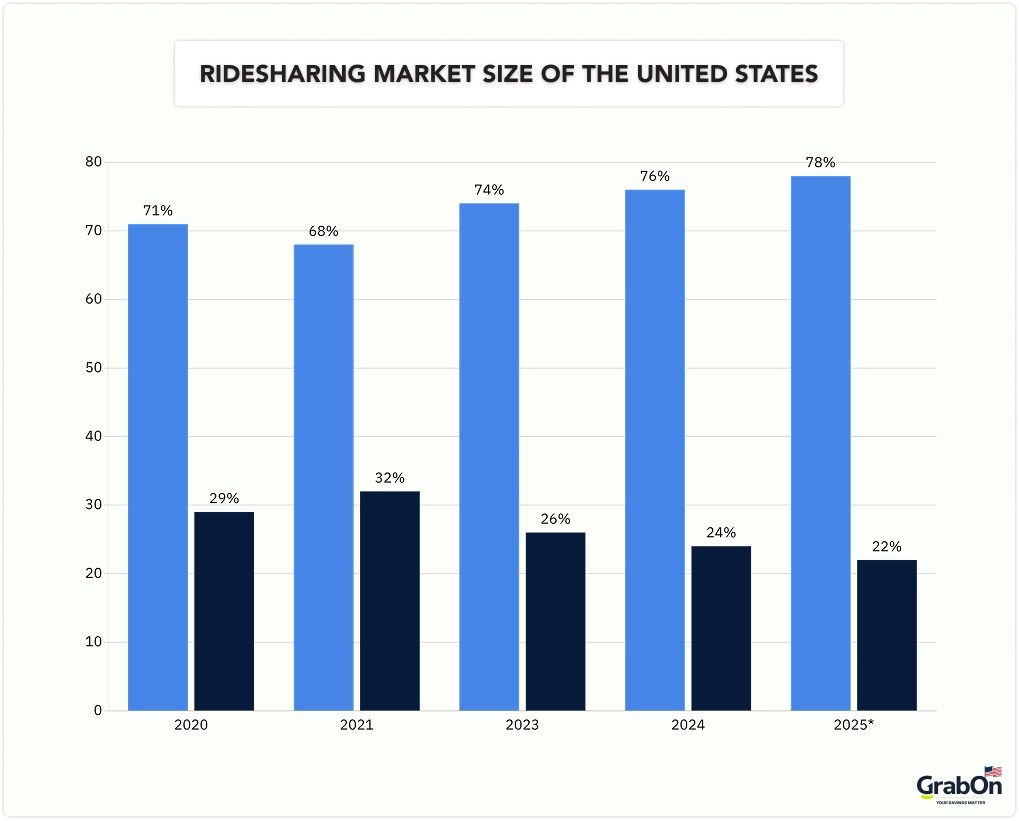
| Year | Share of Uber | Share of Lyft |
| 2020 | 71% | 29% |
| 2021 | 68% | 32% |
| 2023 | 74% | 26% |
| 2024 | 76% | 24% |
| 2025* | 78%* | 22%* |
Source: Bloomberg Second Measure
How many Uber rideshare drivers are there in the United States?
According to reports, as of 2025, there are over 1.7 million ridesharing drivers in the United States. Uber dominated this list with over 1 million drivers, followed by Lyft with 700K drivers.
Between 2014 and 2015, Uber doubled its number of drivers in the U.S., growing from 160,000 to 327,000. Over the past decade, the platform has seen consistent growth and now has over 1 million active rideshare drivers.
Source: Zippia
Uber’s Average Commission Percentage Per Ride-Sharing Trip
Recent surveys show that since 2022, Uber's average commission on each rideshare trip has increased from around 25% to between 32% and 42%.
There are a few rides where Uber took a commission of over 50%.
In international markets, such as the UK, Uber has raised its average commission from 25% to 29%, especially under dynamic pricing models.
Source: Mission Local, Zippia
Uber Company Statistics
Uber has introduced its Uber One Membership program, offering various benefits for its users. Its premium member count has increased exponentially over the years. The brand has also performed better in reducing the gender gap among its employees. According to its press releases, Uber's annual revenue has increased since the COVID-19 pandemic. Here is the detailed breakdown of Uber company statistics:
Uber Membership
As of early 2025, Uber has over 30 million Uber One members globally. This is a 60% year-over-year increase from the previous year. In Q4 2024, the platform has over 5 million Uber One members.
Uber launched its flagship Uber One Membership program in 2021. Since then, it has expanded to over 34 countries.
The membership starts at just $9.99 per month or $96 and gives exclusive benefits on both Uber rides and Uber Eats orders.
Source: Uber Investor
What is the total number of employees at Uber?
Uber has over 31,100 employees globally, a 2.3% increase from 30,400 in the previous year. The brand saw an increase in employee count after a dip in 2023. It had around 32,800 employees in 2022.
Here is the complete breakdown of Uber employees’ numbers over the years:
| Year | Uber's Employee Count | Y-o-Y Change |
| 2021 | 29,300 | + 28.51% |
| 2022 | 32,800 | + 11.95% |
| 2023 | 30,400 | – 7.32% |
| 2024 | 31,100 | + 2.3% |
| 2025* | 32,000* | + 2.89%* |
Source: Statista, MacroTrends
Uber Employees by Gender
Around 57.4% of Uber's workforce is male, while 42.6% is female. In numbers, this means about 17,841 male employees and 13,259 female employees work at Uber. This gender distribution highlights the company's ongoing efforts toward workforce diversity.
Uber has made significant progress in reducing its gender gap. In 2017, the workforce was 63.9% male and 36.1% female. By 2023, it improved to 57.4% male and 42.6% female.
Source: Statista
Uber Revenue Statistics
As of Q2 2025, Uber generated a quarterly revenue of $12.7 billion, which is 18% YoY, and 18% on a constant currency basis. And the income from operations grew 82% YoY to 1.5 billion.
Uber generated a yearly revenue of $43.9 billion in 2024, an 18% increase from $37.1 billion in 2023.
The brand generated a daily revenue of $141.11 million for Quarter 2 of 2025.
The table below shows Uber's revenue from 2021:
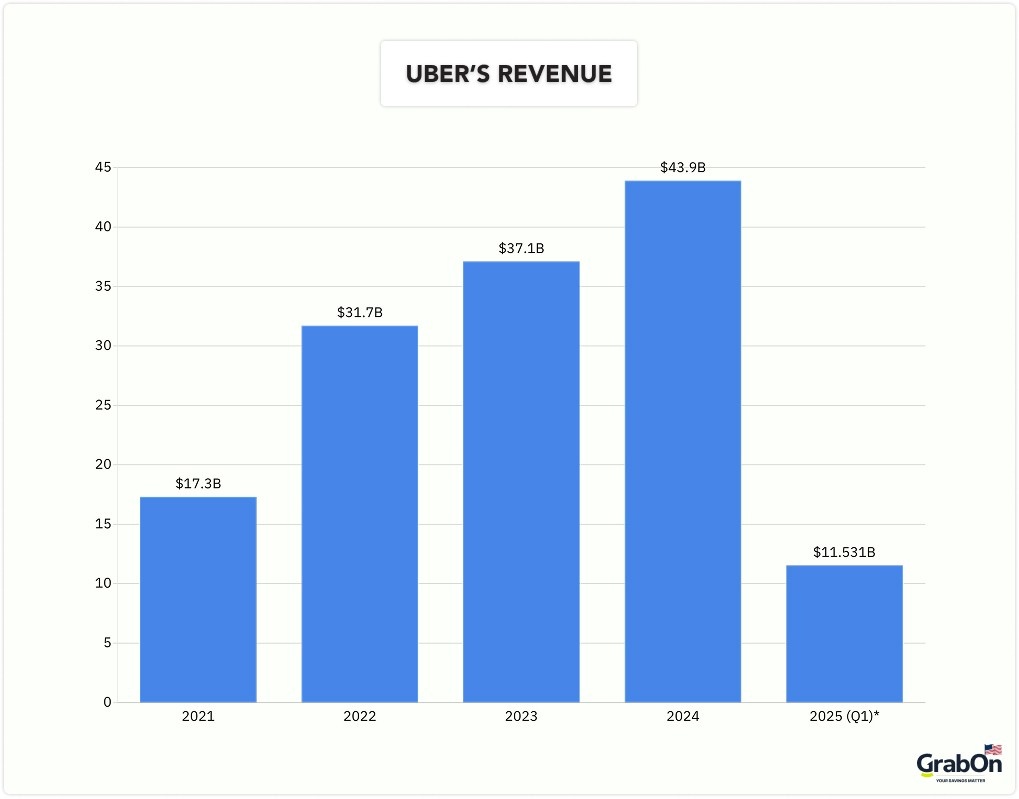
| Year | Uber Revenue |
| 2021 | $17.3 billion |
| 2022 | $31.7 billion |
| 2023 | $37.1 billion |
| 2024 | $43.9 billion |
| 2025 (Q2) | $12.7 billion (Q2) |
Source: Uber Investor
Uber Revenue by Segment
In Q2 2025, Uber reported $7.2 billion in revenue from its Mobility segment, $4.1 billion from Delivery, and $1.2 billion from its Freight business.
Here is the detailed comparison breakdown of Uber's quarterly revenue by segments between 2024 and 2025:
| Quarter | Mobility | Delivery | Freight |
| Q1 2024 | $5.6 billion | $3.2 billion | $1.2 billion |
| Q2 2024 | $6.1 billion | $3.2 billion | $1.2 billion |
| Q3 2024 | $6.4 billion | $3.4 billion | $1.3 billion |
| Q4 2024 | $6.9 billion | $3.7 billion | $1.2 billion |
| Q1 2025 | $6.4 billion | $3.7 billion | $1.2 billion |
| Q2 2025 | $7.2 billion | $4.1 billion | $1.26 billion |
Source: Uber Investor
Wrapping up
These numbers show why Uber has become one of the go-to choices of users. As the platform grows, the demand for it goes up. And sometimes the prices can go higher than average fares. To make things easy, we have curated a list of tried and tested Uber coupons that can help you save more on your rides. While Uber won a net income of $1.4 billion, you can also use the deals shared on GrabOn to scrounge up some savings.
FAQs
How much do Uber drivers make in the US?
As of 2025, Uber drivers earn between $15 and $28 per hour before expenses in the United States. However, their income depends on location, hours worked, and driving strategies.
How many Uber riders are in the US?
It is estimated that there are over 61.5 million riders in the United States as of 2025. When it comes to worldwide numbers, there are over 180 million monthly active users of the platform.