Subscription Cancellation Statistics 2026: Why Americans Quit

Americans think they spend about $86 a month on subscriptions. The real number, once every streaming plan, app, and auto-renewing box is added up, is closer to $219 a month. That $133 blind spot, more than $1,500 a year per person, is the reason behind the 2026 cancellation wave: 47% of U.S. consumers actively canceled at least one subscription this year, up from just 31% in 2024.
Here’s everything the 2026 data shows about why, when, and what Americans are canceling.
Top 5 Subscription Stats of 2026
- Gen Z spends an average of $377 per month on subscriptions.
- A massive 72% of subscriptions run on auto-pay, leading to 42% of people admitting they are still paying for a service they no longer use.
- 47% of consumers actively canceled at least one subscription in 2026.
- 44% of all subscription cancellations happen within the first 90 days of signing up.
- 32.1% of paid users will cancel a premium AI tool if the service becomes too expensive relative to the value it provides.
Why Americans are Canceling Subscriptions
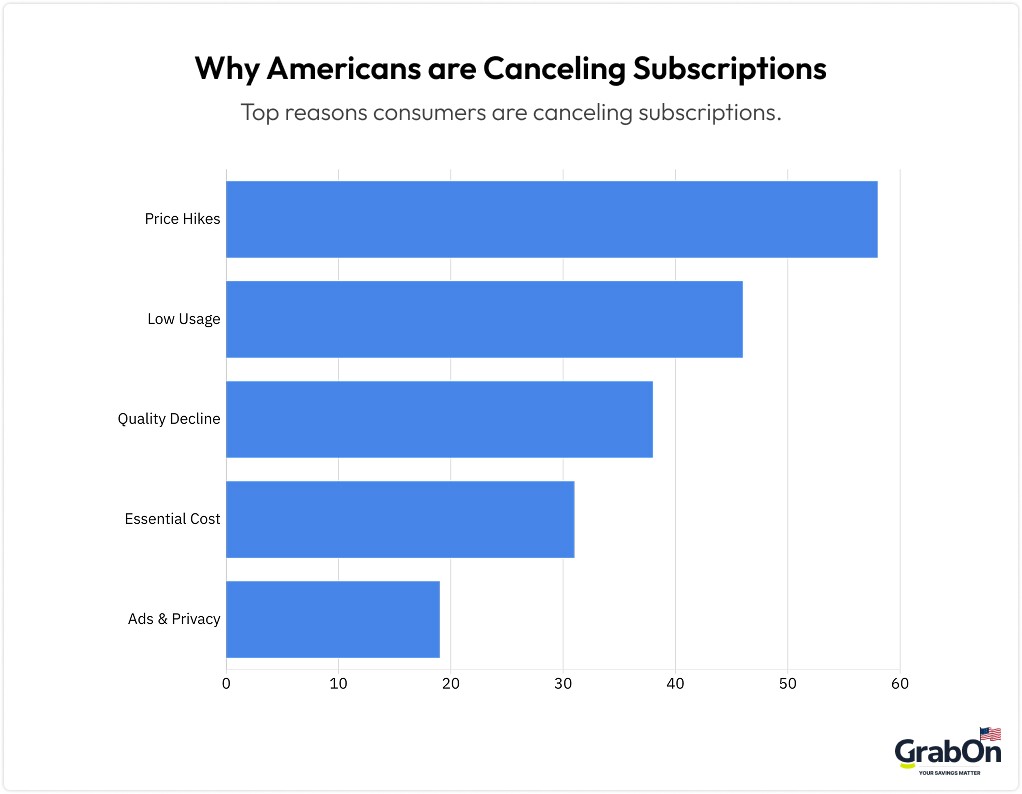
- The main reason for subscription cancellation is rising costs, with 58% of consumers citing recent price hikes as their reason for discontinuing a service.
- A lack of regular use is the second most common reason, with 46% of Americans reporting they canceled because they did not use the service enough in the past 60 days to justify the cost.
- 38% of consumers canceled a service because they felt the quality of the content or the product had declined over time.
- Financial strain from inflation plays a significant role, with 31% of respondents stating they canceled subscriptions solely to pay for essential living expenses like groceries and utilities.
- Frustration with user experience is a growing factor, as 19% of users canceled software or app subscriptions due to excessive ads or invasive data collection.
(Sources: Deloitte Digital Media Monitor, CNET Subscription Survey 2026)
Subscription Cancellation Statistics by Generation
| Demographic | Avg. Monthly Spend | Top Cancellation Trigger |
| Gen Z | $377 | Finishing a specific show/event |
| Millennials | $276 | Subscription overwhelm |
| Parents (with kids < 18) | Highest Volume | Need to streamline expenses |
Gen Z Subscription Habits
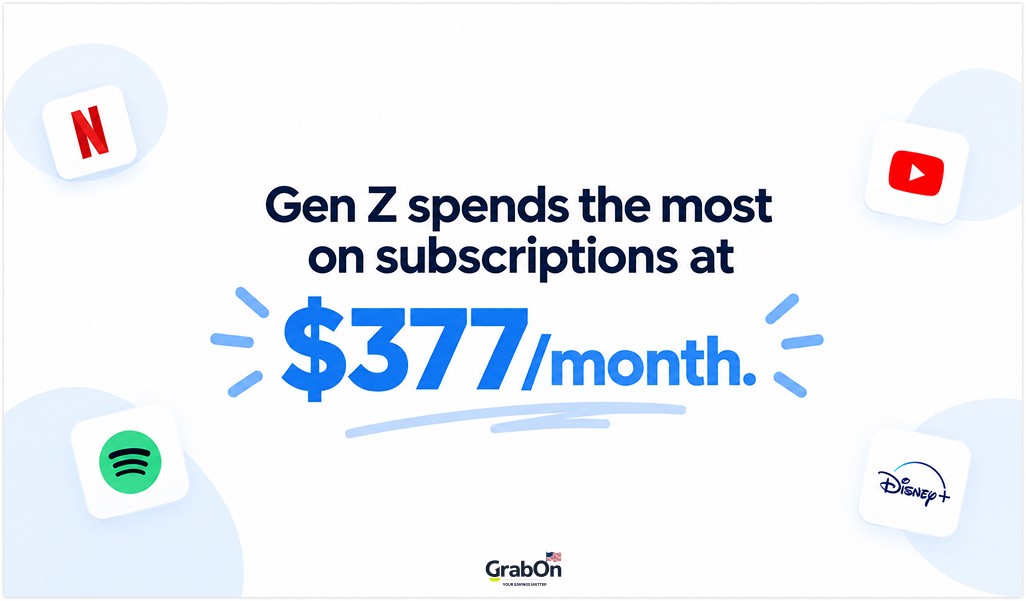
- Gen Z currently holds the highest recurring monthly subscriptions, spending an average of $377 per month on creator platforms and premium apps.
- Members of Gen Z are 2.5 times more likely than Boomers to subscribe to a service just to watch one specific show or event, only to cancel it the following month.
- 64% of Gen Z consumers prefer to use social media video platforms for entertainment over paid traditional streaming. This makes them highly prone to canceling standard SVOD (Subscription Video on Demand) services.
Millennials and Subscription Fatigue
- Millennials carry the second-highest subscription burden, averaging $276 per month across household, entertainment, and professional services.
- 51% of Millennials report feeling overwhelmed by the sheer number of subscriptions they need to manage their daily lives.
- Millennials are the most likely to use budgeting tools and tracking apps to find and cancel unwanted subscriptions.
Parents vs. Non-Parents
- Households with children under 18 maintain an average of 4.5 more active subscriptions than non-parent households, largely driven by educational apps, family gaming passes, and meal kits.
- Parents report a 40% higher churn rate on physical subscription boxes (like toy or clothing deliveries) compared to digital-only subscriptions.
- Nearly 60% of parents cite “streamlining household expenses” as their primary reason for cutting back on duplicate entertainment subscriptions.
(Sources: Deloitte Media and Entertainment Industry Outlook, Self.inc)
Streaming-Specific Cancellation Stats
- The average household churn rate for premium streaming services has reached an all-time high of 17% in the first half of 2026.
- Industry research highlights a growing “churn and return” behavior, with 43% of consumers admitting to canceling a streaming service only to resubscribe within six months when a new season of their favorite show premieres.
- Over 35% of subscribers canceled a secondary streaming platform because their main service already offered all the content they needed.
- Following recent account-sharing crackdowns, 22% of affected users canceled their service instead of upgrading to a paid individual account.
(Sources: Deloitte Media and Entertainment Industry Outlook)
Subscription Cancellation Statistics by Category
Consumers are now categorizing their recurring expenses into “must-haves” and “nice-to-haves.”
| Subscription Category | Key Cancellation Metric | Primary Driver of Churn |
| Streaming & Entertainment | 68% review bundles bi-annually | Market saturation & cost-cutting |
| Meal Kits & Physical Boxes | 70% cancel before the 6th box | High shipping costs & delivery errors |
| Fitness & Wellness Apps | 55% cancel between March-May | New Year’s resolution drop-off |
| AI Tools & Software | 45% drop-off after 3 months | Fading novelty & tech consolidation |
| News, Media & Newsletters | 34% cancel if frequency drops | “News fatigue” & lack of updates |
Streaming and Entertainment
- Entertainment subscriptions face the highest volatility, with 68% of consumers stating they review their streaming bundles at least twice a year for potential cuts.
- Audio and music streaming maintain higher retention, with only 12% of users canceling their primary music subscription in 2026.
Most Commonly Unused Paid Streaming Subscriptions (2026)
| Rank | Service | Share Unused in Past 30 Days |
| 1 | Starz | 49.6% |
| 2 | Disney+ | 44.4% |
| 3 | Netflix | 38.1% |
| 4 | HBO Max | 35.7% |
| 5 | Apple TV+ | 34.1% |
AI Tools and Software
- Professional software habits are shifting. In fact, 32.1% of users say they’ll instantly cancel a premium AI service if it no longer feels worth the cost for everyday use.
- Generative AI tool subscriptions see a steep 45% drop-off rate after the first three months of usage, as novelty fades and users consolidate down to one primary AI assistant.
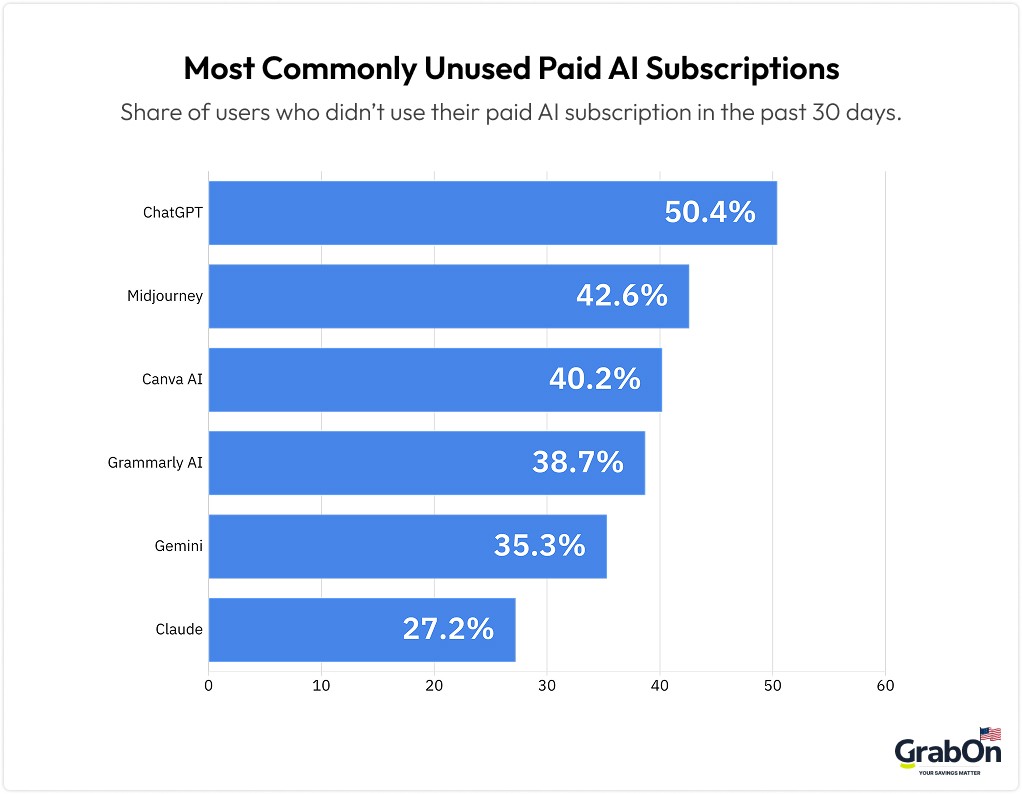
Most Commonly Unused Paid AI Subscriptions
| AI Tool | Share Unused in Past 30 Days |
| ChatGPT | 50.4% |
| Midjourney | 42.6% |
| Canva AI | 40.2% |
| Grammarly AI | 38.7% |
| Gemini | 35.3% |
| Claude | 27.2% |
Fitness and Wellness Apps
- Digital fitness apps are facing a 28% year-over-year cancellation rate as post-pandemic fatigue continues to impact the wellness sector.
- Mindfulness and meditation apps see a high seasonal churn, with 55% of cancellations occurring between March and May after New Year’s resolutions fade.
News, Media, and Newsletters
- Paid newsletters and independent media boast strong retention rates, but 34% of subscribers will cancel if a creator stops publishing for over a month.
- Traditional digital news subscriptions see a 20% cancellation rate, with users frequently citing “news fatigue” as a primary reason for unsubscribing.
- Meal Kits and Subscription Boxes
- Physical meal kits face the highest short-term cancellation of any subscription, losing 70% of new users before the sixth box.
- 62% of former users cite high shipping costs and unreliable deliveries as their main reason for canceling meal kits and subscription boxes.
(Sources: Readless App Subscription Fatigue Statistics, Self, Deloitte Insights)
Forgotten Trials and “Silent” Cancellation Costs
- The subscription industry heavily profits from the “Auto-Pay Trap,” with 72% of consumers keeping their subscriptions set to auto-pay by default.
- The automated payment system leads to 42% of people admitting they are currently paying for a service they entirely forgot about and no longer use.
- Americans waste an estimated $133 per year on average on “ghost subscriptions” that auto-renewed after a free trial period ended.
- 29% of consumers say they have delayed canceling a subscription for over three months simply because they forgot their password or could not easily find the cancellation button.
(Sources: Self.inc, Resubs App Subscription Spending Statistics)
The Rise of AI Subscription Fatigue
- Consumers are overwhelmed by “AI add-ons.” 41% of software users are frustrated that platforms charge separate, premium subscription tiers just to access AI features.
- About 32.1% of early adopters say they will cancel a premium AI subscription if they feel they aren’t getting enough everyday value for the price.
- Rather than paying for multiple specialized AI tools, 58% of professionals have canceled secondary apps to consolidate their budget into a single, multi-modal AI platform.
- Because AI models feel largely interchangeable, 26% of users continually sign up for trials, cancel them, and move on in search of a lower price.
(Source: CNET Subscription Survey 2026)
Subscription Cancellation vs. Subscription Growth
- The global subscription economy is still projected to grow to $1.5 trillion in the coming years. This proves that while individual churn is high, the overall market continues to expand.
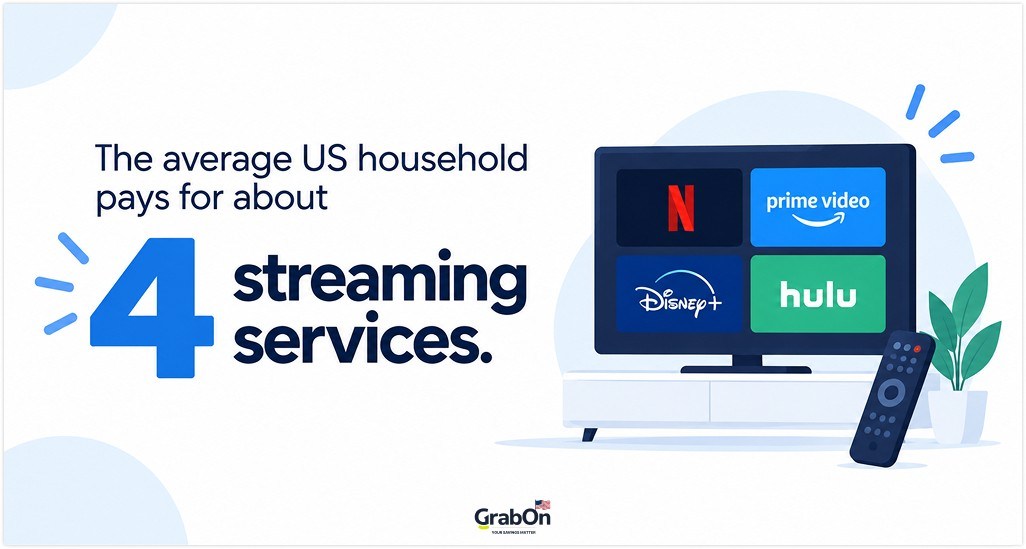
- The average US household still pays for about 4 streaming services. This shows that consumers are just becoming more selective about what they keep.
- Subscription box services that offer hyper-personalized, necessity-based items (like pet care or specialized health products) are seeing a 15% growth in retention despite the wider market churn.
- 78% of consumers will try a new subscription service if no credit card is required upfront, proving that risk-free trials remain a massive driver for sign-ups.
(Sources: Deloitte Insights, Resubs.Spending Data)
The 90-Day Danger Zone: When Do Consumers Actually Cancel?
| Subscriber Lifecycle | Churn Risk Level | Core Reason for Cancellation |
| Day 1 – Day 31 | Extreme Risk | 48% drop-off at first actual charge after trial |
| Day 32 – Day 90 | High Risk | 65% of total SaaS cancellations occur here (Danger Zone) |
| Month 3 – Month 12 | Stable | User has fully integrated the tool/app into routines. |
| Month 13+ | Moderate Risk | Annual renewals trigger massive budget re-evaluations |
- The first 90 days are the most critical period for SaaS and B2B subscriptions, accounting for 65% of all cancellations.
- Free-to-paid trial conversions face a massive drop-off on Day 31. 48% of users immediately cancel the moment they see the first actual charge hit their bank statement.
- For long-term subscribers, the 13-month mark is a major cancellation trigger, as annual renewals force users to re-evaluate their usage over the past year.
- Subscribers who go 14 consecutive days without logging in during their first month have an 82% chance of canceling by month three.
(Sources: Readless App Churn Data)
“Quiet Price Hikes” and the Loss of Trust
- The subscription industry has increasingly relied on the controversial ‘$1-$3 trick,’ quiet price hikes that add just a few dollars to a service, slipping past consumers unnoticed.
- While seemingly small, these micro-hikes have compounded aggressively, pushing the average household’s monthly subscription bills $15 to $30 higher without any new services being added.
- Over 60% of consumers report feeling actively “deceived” by companies that raise subscription prices without sending a clear, dedicated email warning at least 30 days in advance.
- Once a quiet price hike breaks their trust, subscribers are 3 times more likely to cancel the service entirely than to switch to a cheaper plan.
(Sources: Resubs.app Subscription Stats, CNET Survey)
The “Subscription Audit” Trend
- “Subscription audits” have become a massive cultural and social media trend, driven largely by Gen Z and Millennials seeking financial control.
- Budgeting influencers on platforms like TikTok have turned cost-cutting into a viral challenge, prompting users to review and cut recurring charges.
- As part of this trend, 72% of consumers reviewed their auto-pay settings in 2026, directly resulting in mass cancellations of services they had forgotten about.
- Banking apps offering ‘one-click subscription blocking’ have seen a 400% surge in use. Consumers prefer stopping payments directly through their bank rather than navigating confusing cancellation pages.
(Source: Self.inc)
FTC’s Click-to-Cancel Rule: What It Means for Subscriptions
The government is now requiring companies to make canceling a subscription as easy as signing up for one. The rule is already reshaping how businesses handle cancellations and, in turn, their churn numbers.
- The Federal Trade Commission’s strict 2024 “Click-to-Cancel” rule, which mandated that canceling a subscription must be exactly as easy as signing up, was highly controversial and ultimately vacated by a U.S. Appeals Court in 2025 on procedural grounds.
- Despite the rule being struck down, the FTC announced an Advance Notice of Proposed Rulemaking in early 2026 to revive it, and aggressively polices difficult cancellation processes as deceptive practices under Section 5 of the FTC Act.
- Because some cancellation processes are so intentionally difficult, consumers are going to extreme lengths to bypass them. Some users have even resorted to the ‘prison excuse,’ telling customer service reps they are about to be incarcerated just to get their accounts closed immediately.
- Companies that make customers call in to cancel get 60% more complaints and negative app store reviews than those offering simple, self-serve cancellation.
(Sources: Sidley Austin Regulatory Update 2026)
How the Industry is Responding (The Pivot)
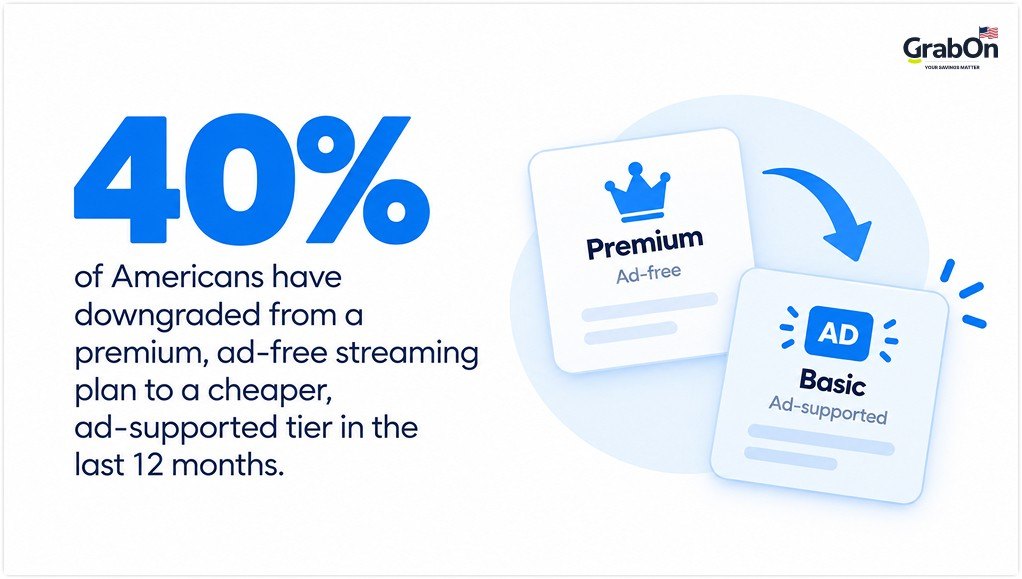
- Because users are acutely price-sensitive, 40% of Americans have actively downgraded from a premium, ad-free streaming plan to a cheaper, ad-supported tier in the last 12 months.
- To keep customers from leaving entirely, 61% of SaaS and software companies have moved away from flat monthly fees toward usage-based or hybrid pricing.
- “Pause” options are becoming standard. When companies offer a “pause before cancel” option, pause usage rises by 337%, successfully saving up to 75% of accounts from permanent deletion.
- Bundling is making a comeback. Telecom and credit card companies are now covering streaming and software costs as part of larger packages, making those subscriptions harder to cancel individually.
Ad-Supported Tier Downgrades by Platform (Past 12 Months)
| Platform | Share of Subscribers Who Downgraded to Ad Tier |
| Netflix | 18% |
| Hulu | 13% |
| Amazon Prime Video | 13% |
(Sources: Recurly State of Subscriptions 2026, Deloitte Report)
The Bottom Line
Subscription fatigue in 2026 isn’t about Americans rejecting recurring services. It’s about closing the $133-a-month gap between what people think they’re paying and what’s actually leaving their accounts. Rising prices, underuse, and the auto-pay trap are driving cancellations.
The industry is adapting faster than churn numbers suggest. Ad-supported tiers, pause-before-cancel options, and usage-based pricing are already reducing permanent cancellations by double digits. For subscribers, the takeaway is simple: review auto-pay settings regularly, track the 90-day mark on any new sign-up, and don’t ignore those sneaky price hikes.