In-Store vs Online Shopping Statistics in 2025
Is online shopping really taking over the world? Maybe! Out of a world population of 8.12 billion, around 2.71 billion people shopped online in 2024. That makes up 33.4% of all people worldwide.
With these numbers, you may assume that in-store shopping is fading, but it is still going strong. About 45% of consumers prefer to shop in brick-and-mortar stores. This shows that people prefer both online and in-store shopping.
The shopping habits of people are evolving, and with Gen Z in the mix, shopping habits are undergoing a drastic change. In this blog, we highlight stats that can help you understand consumer behavior and make smarter decisions for your business.
Top In-Store vs Online Shopping Statistics in 2025
- By 2025, global retail e-commerce sales are expected to surpass 4.3 trillion U.S. dollars, with steady growth projected in the years ahead.
- Online shopping continues to grow, and by 2027, around 22.6% of all retail sales are predicted to happen online.
- Before making a purchase, about 81% of retail shoppers first turn to online research, showing how strongly the buying journey begins on the internet.
- In 2024, around 2.71 billion people shopped online worldwide, which is about 33.4% of the global population.
- The United States alone had 268 million online shoppers in 2022, a number expected to climb to nearly 285 million by 2025.
An Overview of Shoppers for In-Store vs Online Shopping
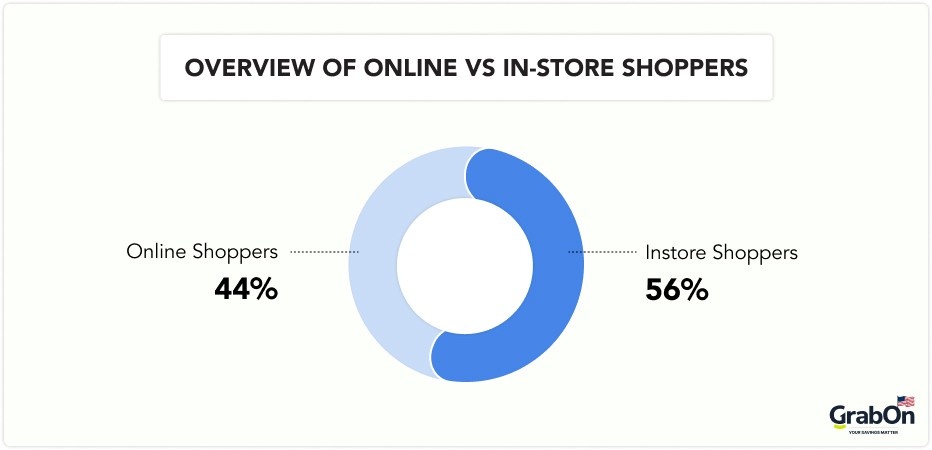
Based on our research, the number of people who shopped in-store is much larger than the number who shopped online. While 2.71 billion people made online purchases in 2024 (that is, 33.4% of the world's population), approximately 3.5 billion people shopped in stores. Although there isn't a directly stated global headcount for in-store shoppers, we estimated the value using the available data at our disposal.
- If 80.4% of retail revenue came from in-store shopping, and considering blended shopping habits (many people shop both in-store and online), well over half of the world's population is in-store shoppers.
- Surveys suggest at least 45% of consumers (and up to 71% according to some studies) still shop in-store, often seeing it as central to their shopping experience.
- Therefore, the number of in-store shoppers worldwide in 2024 is likely well above three billion, and could easily be between 3.5-5 billion, but the exact global figure is not specified in the available stats.
- In 2022, there were 268 million online shoppers in the United States, and the number is projected to increase to almost 285 million online shoppers in 2025.
While this number may be shocking to some, it confirms that physical retail is still a dominant force in global shopping behavior, even as online shopping grows rapidly.
Source: eMarketer, CapitalOne, Global Digital Shopping Index 2024, Statista
Comparison of In-Store vs. Online Shopping Revenue
As we deduced in the previous section, the number of in-store shoppers is more than online shoppers, which also contributes to the revenue. In-store sales are more than online sales in America.
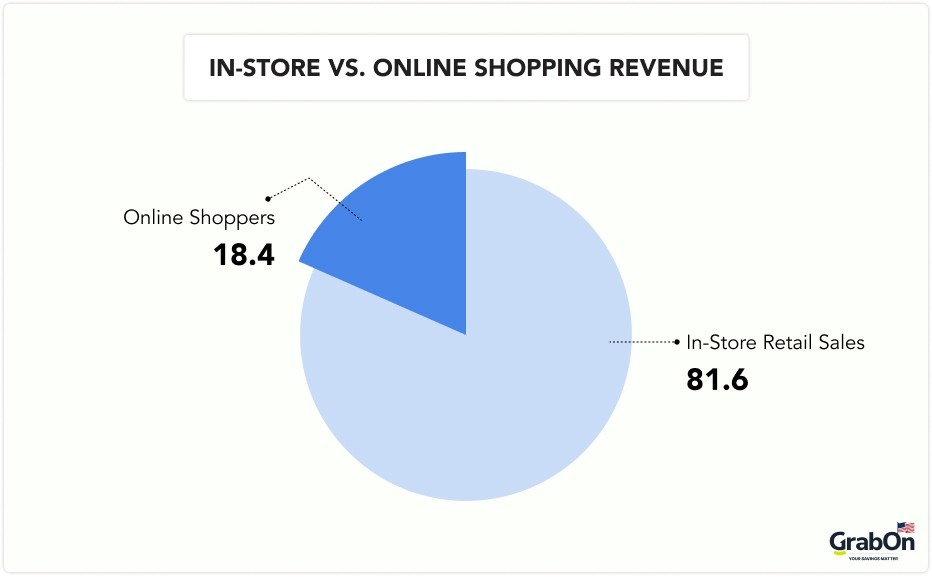
- Consumers in the U.S spent $5.927 trillion in retail stores (81.6%) and $1.337 trillion online (18.4%) in 2024.
- By the end of 2025, the global retail e-commerce sales are expected to surpass 4.3 trillion U.S. dollars.
- In the first two months of 2025, shoppers spent $555.5 billion on retail, with only 18.9% on e-commerce.
- In the fourth quarter (Q4) of 2024, consumers spent $1.977 trillion on retail, with 17.9% of that amount coming from e-commerce sales.
- The share of e-commerce in total retail sales grew by 6.36% in 2024 compared to 2023, showing strong online shopping growth year over year.
- Between Q3 and Q4 of 2024, in-store sales rose by 3.87%, while e-commerce sales jumped by 14.4%, highlighting faster growth online during that period. The increased online sales may be due to the holiday season.
Source: CapitalOne, Statista
U.S Retail Sales Growth In-Store Vs Online Shopping
From 2023 to 2024, US In-store retail sales grew by 1.37% from $5.85 trillion to $ 5.93 trillion. While the online retail sales grew 9.84% from $1.22 trillion to $1.34 trillion. This shows that the online sales grew significantly faster in the past year. From 2009, the online sales growth has picked up and grown 10X in the past decade.
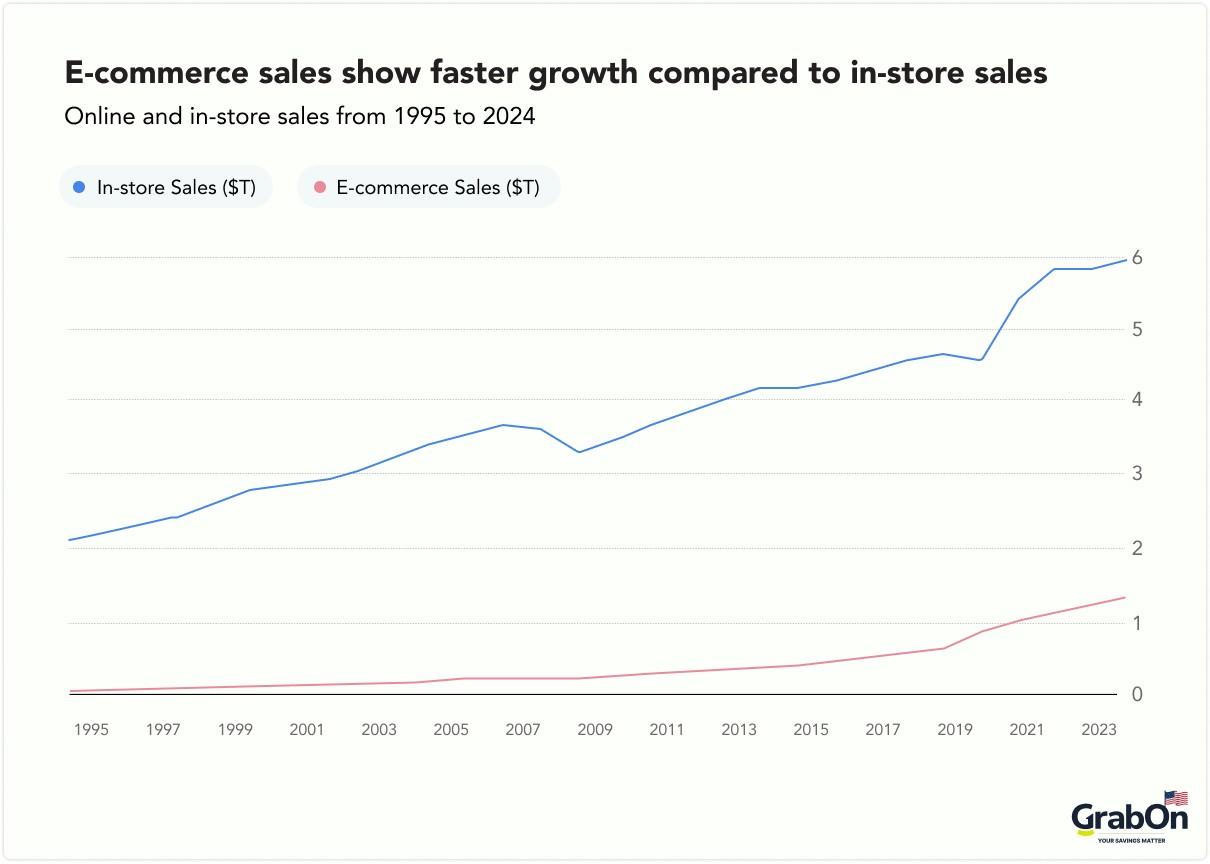
The table below showcases the sales that have happened through online shopping and in-store shopping in the past 20 years.
| Year | In-store Sales ($T) | E-commerce Sales ($T) |
| 2024 | 5.93 | 1.34 |
| 2023 | 5.85 | 1.22 |
| 2022 | 5.82 | 1.10 |
| 2021 | 5.39 | 1.00 |
| 2020 | 4.60 | 0.87 |
| 2019 | 4.66 | 0.65 |
| 2018 | 4.59 | 0.58 |
| 2017 | 4.43 | 0.52 |
| 2016 | 4.30 | 0.46 |
| 2015 | 4.23 | 0.41 |
| 2014 | 4.19 | 0.37 |
| 2013 | 4.04 | 0.34 |
| 2012 | 3.90 | 0.32 |
| 2011 | 3.73 | 0.29 |
| 2010 | 3.48 | 0.26 |
| 2009 | 3.31 | 0.23 |
| 2008 | 3.63 | 0.23 |
| 2007 | 3.69 | 0.22 |
| 2006 | 3.59 | 0.20 |
| 2005 | 3.44 | 0.17 |
| 2004 | 3.24 | 0.15 |
| 2003 | 3.06 | 0.13 |
| 2002 | 2.94 | 0.12 |
| 2001 | 2.88 | 0.11 |
| 2000 | 2.80 | 0.11 |
| 1999 | 2.64 | 0.09 |
| 1998 | 2.44 | 0.08 |
| 1997 | 2.34 | 0.07 |
| 1996 | 2.24 | 0.06 |
| 1995 | 2.11 | 0.05 |
Source: CapitalOne
In-Store vs Online Shopping Preferences by Generations
According to various surveys, the older generations, like the Baby Boomer Generation and Gen X, like to shop primarily in stores, while the younger generation, like the Millennials and Gen Z, prefer to shop online or use hybrid methods.
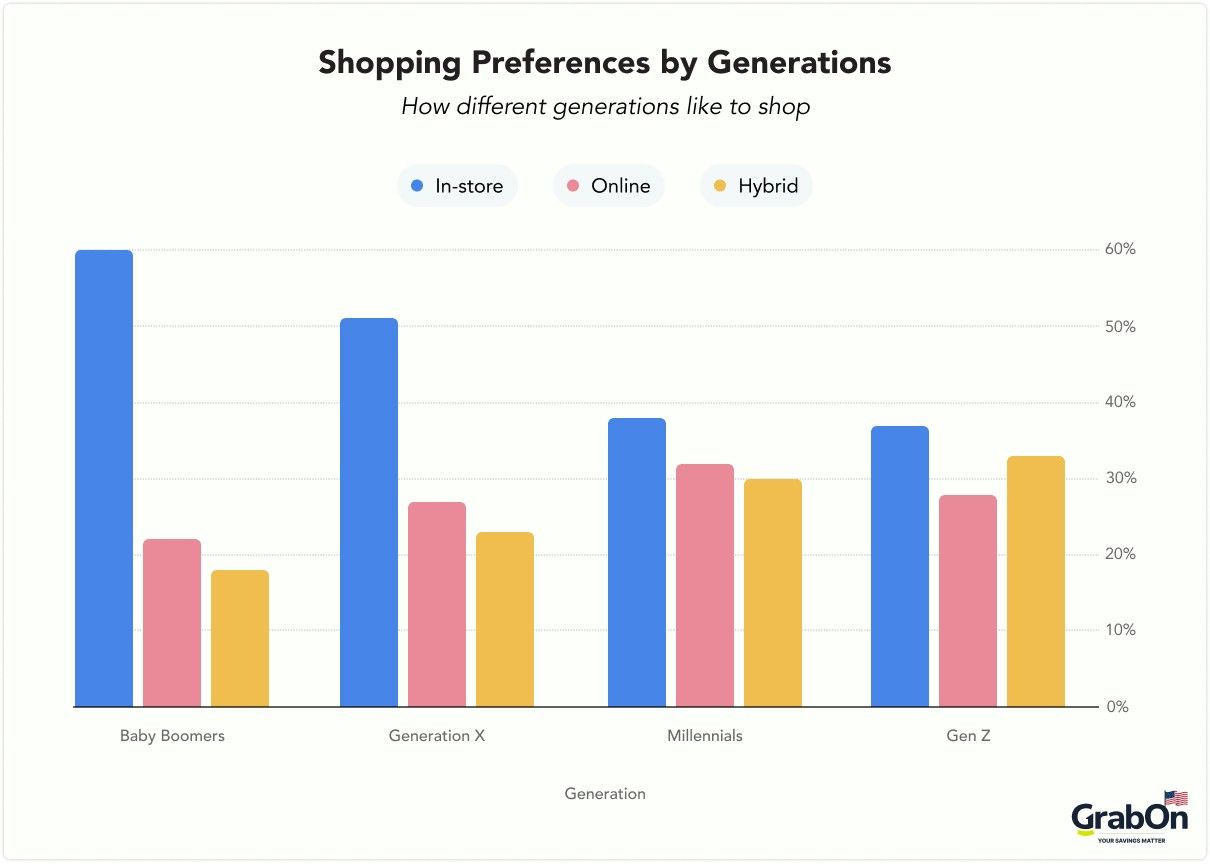
- Among Baby Boomers, a strong majority of 60% favor shopping in physical stores, while just 22% prefer shopping online, and 18% enjoy a mix of both in-store and online shopping, often called hybrid shopping.
- Generation X shoppers show more balance, with 51% preferring in-store shopping, 27% choosing online, and 23% opting for a hybrid approach combining both channels.
- Millennials lean more toward online shopping, although preferences remain varied. 38% still prefer shopping in-store, 32% favor online purchases, and a significant 30% like to blend both methods.
- Generation Z shoppers are the most inclined to hybrid shopping, with 33% embracing a mix of in-store and online experiences. Meanwhile, 37% prefer in-store and 28% choose online shopping as their primary mode.
Source: CapitalOne
Why Consumers Choose Online vs In-Store Shopping
There are various reasons why consumers prefer online and in-store shopping. The shopping habits are influenced by a variety of reasons, like convenience, shipping, and more. According to surveys, people prefer shopping for groceries in-store rather than online, and consumers prefer buying electronics and apparel online rather than in-store. But before making a purchase, about 81% of retail shoppers first turn to online research.
| Shopping Mode | Reasons for Preference | Percentage of Consumers (%) |
| In-store | Prefer tactile experience (touch/look/try products) | 53% |
| More enjoyable shopping experience | 53% | |
| Ease of product comparison | 46-49% | |
| Convenience of immediate purchase | 45% | |
| Prefer to avoid online issues like shipping delays | (Implied but not exact %) | |
| Grocery and household goods are bought mostly in-store | 81-80% (online grocery low) | |
| Online | Convenience of shopping anytime/anywhere | 71% |
| Time-saving compared to a store visit | 61% | |
| Better availability of products | (No exact %, implied high) | |
| Avoid crowds | (Implied) | |
| Personal electronics, apparel, shoes, and beauty products are preferred online | 33-37% | |
| A growing trend of young shoppers preferring online | (Higher among Millennials and Gen Z) |
Source: Salsify, GE Capital Retail Bank Research
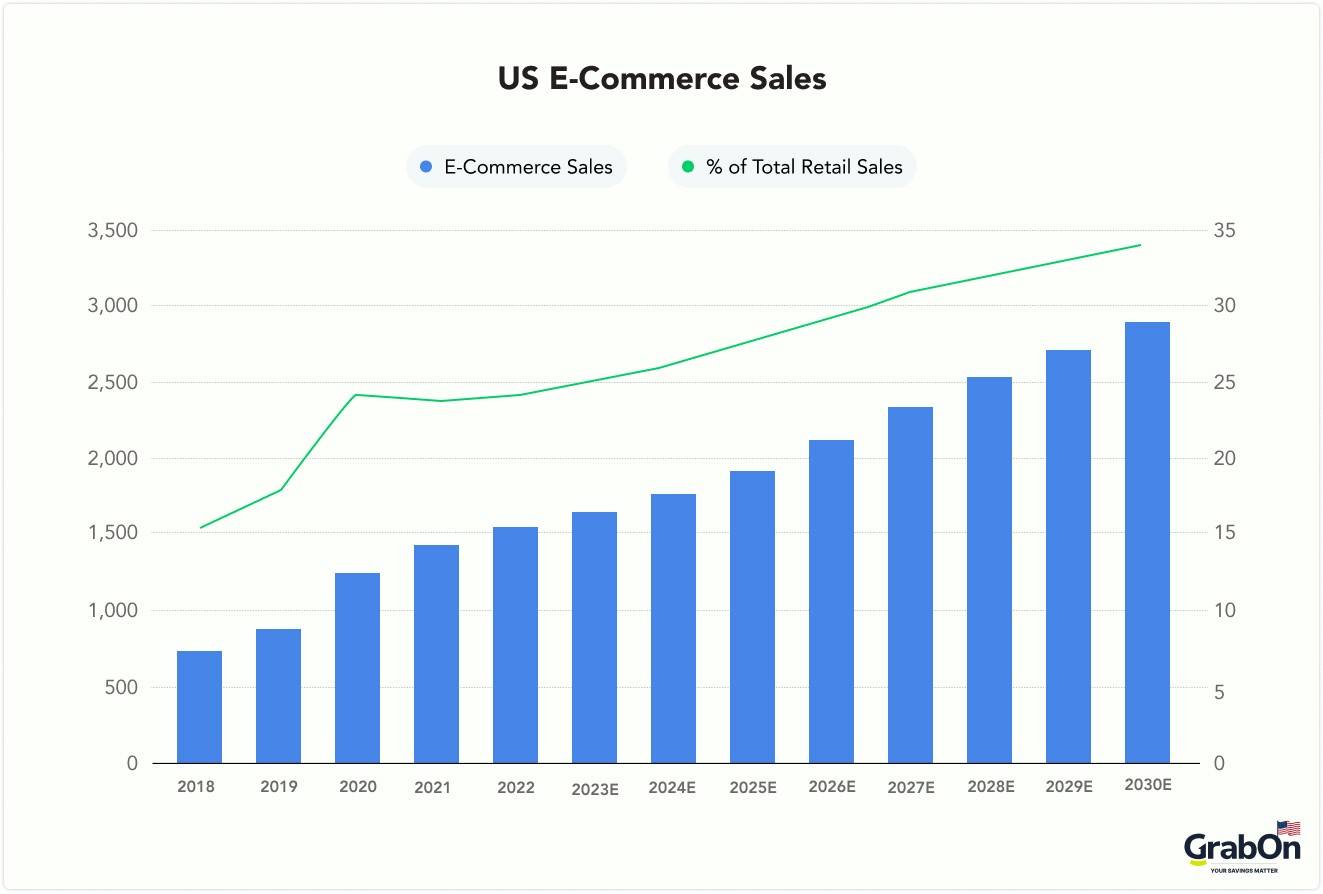
Growth and Projection of In-Store vs Online Shopping Sales
While in-store sales contribute to a huge chunk of the sales revenue, online sales are growing at a rapid rate. But many consumers still prefer in-store shopping.
Growth of In-Store Shopping Sales
- 45% of the buyers shop in physical brick-and-mortar stores.
- 72% of the consumers shop in physical stores every week.
- It is anticipated that 80.8% of retail purchases will take place in physical stores in 2025.
- In the last 10 years, from 2014 to 2024, the total in-store retail sales increased by 31.8%.
- Surveys also hinted that consumers primarily bought groceries in-store, along with personal care and beauty products.
| Categories bought in-store | Percentage |
| Groceries | 62% |
| Personal care and beauty | 50% |
| Apparel and footwear | 40% |
| Home goods | 28% |
Growth of Online Shopping Sales
Online sales numbers suggest that consumers prefer buying electronics and apparel online. It may be due to convenience and lower price points.
- 28% of Americans favor online shopping over visiting physical stores.
- Among those who choose online shopping, 71% cite convenience as their main reason.
- By 2027, 22.6% of total retail sales will be conducted online.
- 61% of online-first shoppers say they opt for online shopping to save time.
- When it comes to personal electronics, 37% of consumers prefer making purchases online rather than in-store.
- Around 1 in 6 retail dollars spent in the U.S. is now through online channels.
- Globally, e-commerce revenue is expected to hit $3.66 trillion in 2025 and show a 6.29% compound annual growth rate through 2030.
- Online shopping sales in the United States are projected to reach $1.29 trillion by the end of 2025, rising to $2.9 trillion by 2030.
| Categories bought online | Percentage |
| Clothing | 43% |
| Shoes | 33% |
| Furniture and home furnishing | 8.83% |
Source: CapitalOne, Bloomberg, Mordor Intelligence, Quarterly Retail E-commerce sales report, Forbes
An Overview of the Big Players in the E-commerce Market
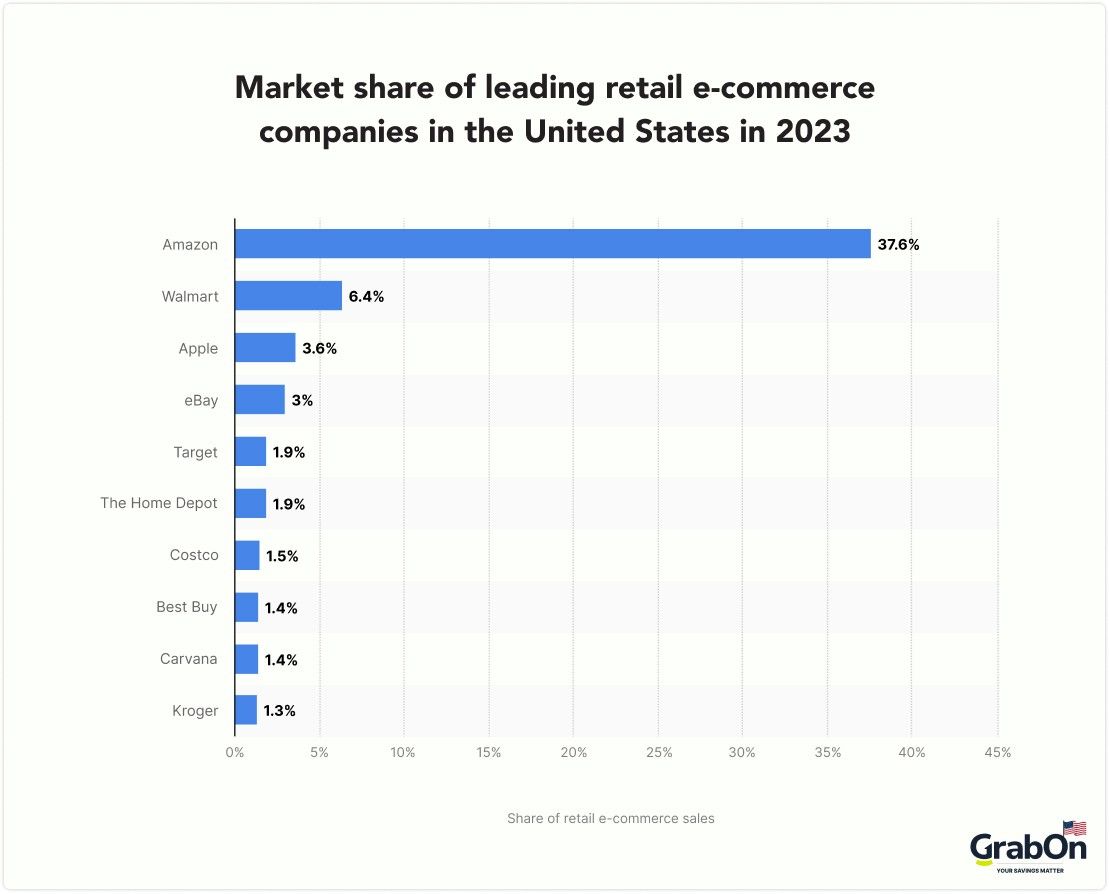
Although it can be challenging to precisely determine which brick-and-mortar retailers contribute to overall in-store sales, it is quite easy to identify the big players in the e-commerce game. Amazon, Walmart, and Apple currently lead the U.S. e-commerce market. Additionally, in recent years, Chinese companies such as Temu and Shein have established a significant presence within the U.S. online retail landscape.
Amazon leads the race. In 2024, Amazon generated $144 billion via e-commerce sales in the country, followed by Walmart, which generated about $79 million via online sales. It is to be noted that Walmart is the largest retailer in the US, with $534 billion in retail sales (that includes both online and in-store sales).
Source: St atista
Popular Shopping Categories for In-Store vs Online Shopping
The interesting fact is that all the top online shopping categories are increasing year over year. Computer and consumer electronics seem to be the leading category, contributing $219.33 billion in retail e-commerce. But there is a split in the market between e-commerce and physical sales, so let's have a look at the categories that are popular online as well as in-store.
| Category | Online Shopping Revenue (in Billions) | % of Total US eCommerce Sales | Online vs In-Store Market Share |
| Computer and Consumer Electronics | $219.33 | 21.2% | 56.3% online vs 43.7% physical |
| Apparel and Accessories | $203.75 | 19.7% | 37.0% online vs 63.0% physical |
| Furniture and Home Furnishings | $129.45 | 12.5% | 32.6% online vs 67.4% physical |
| Health, Personal Care, and Beauty | $111.03 | 10.7% | 17.2% online vs 82.8% physical |
| Auto and Parts | $86.26 | 8.3% | 5.2% online vs 94.8% physical |
| Food and Beverage | $78.28 | 7.6% | 6.4% online vs 93.6% physical |
| Toys and Hobby | $74.03 | 7.2% | 42.4% online vs 57.6% physical |
| Books, Music, Video | $54.02 | 5.2% | 68.4% online vs 31.6% physical |
| Office Equipment and Supplies | $19.35 | 1.9% | 39.9% online vs 60.2% physical |
Impact of Seasonal Shopping on In-Store vs Online Sales
The major sales events, like Black Friday and Cyber Monday, contribute to a huge chunk of sales in the U.S. The last quarter of the year brings in the most sales because that's when the year's holiday shopping happens online.
- The volume of sales peaks during the fourth quarter, that is, the holiday season, with a significant increase in online sales. For example, in Q4 2022, the online retail sales reached $303.1 billion, which was 23.4% higher than the first three quarters of the year, with an average of $245.6 billion.
- On top of that, the online sales also rise during the holiday season. Online sales accounted for 16.3% of all retail sales in Q4 2022, as compared to 14.1% in the first three quarters.
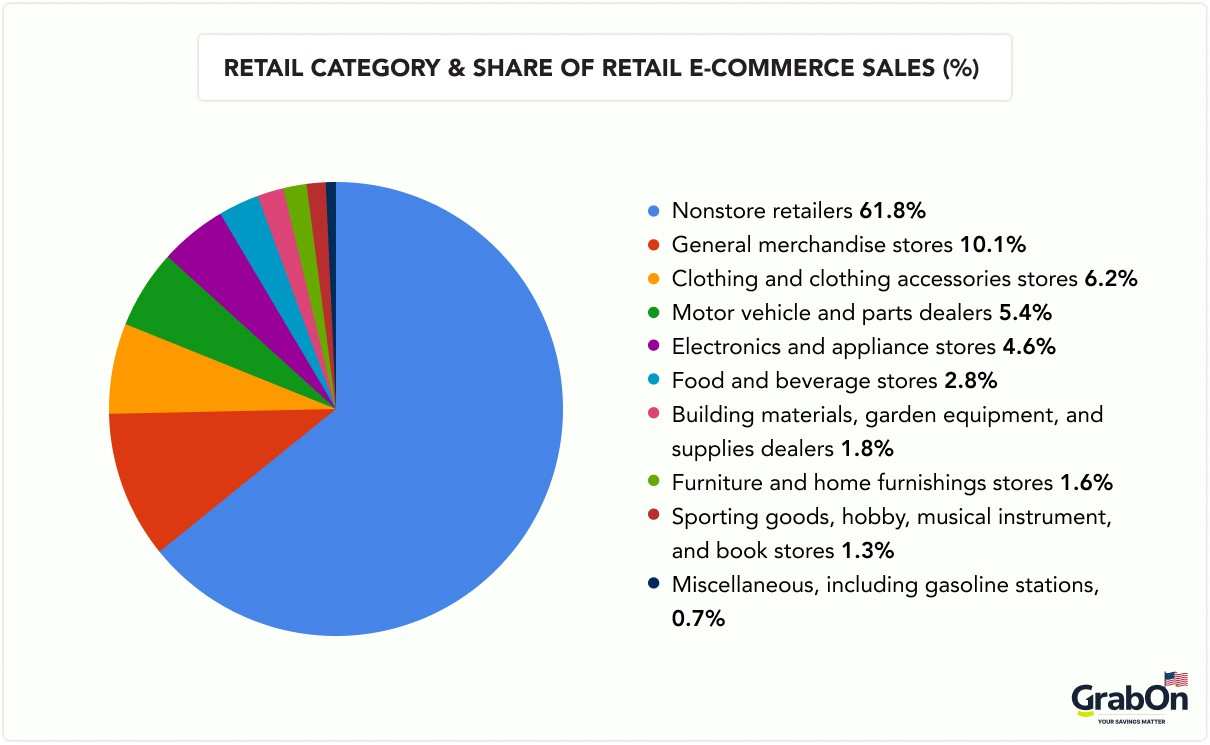
- Nonstore retailers (businesses without physical stores) benefit more from the sales season. These retailers captured nearly 62% of all retail e-commerce sales in the third quarter of 2023. The graph below shows who gets the most sales during the peak season.
Source: Pew Research
Shopping Industry Trends To Look Out For
It may be a general assumption that people shop online more than they do offline. But the numbers tell a different story. 71% of the shoppers around the world prefer physical stores over online shopping. The shopping habits have evolved, leading to Hybrid shopping experiences where people shop both in-store and online. It is also called Click and Mortar shopping.
- This hybrid shopping approach has grown by 38% since 2020 across various countries like the US, UK, and Brazil.
- According to surveys, 39% consumers in the world identify as Click and Mortar shoppers.
- Younger generations like the Gen Z and the Millennials are adopting hybrid shopping methods, whereas the Baby Boomers and Seniors are prioritizing shopping in-store. Gen Z adoption of Click and Mortar shopping is double that of baby boomers and other generations.
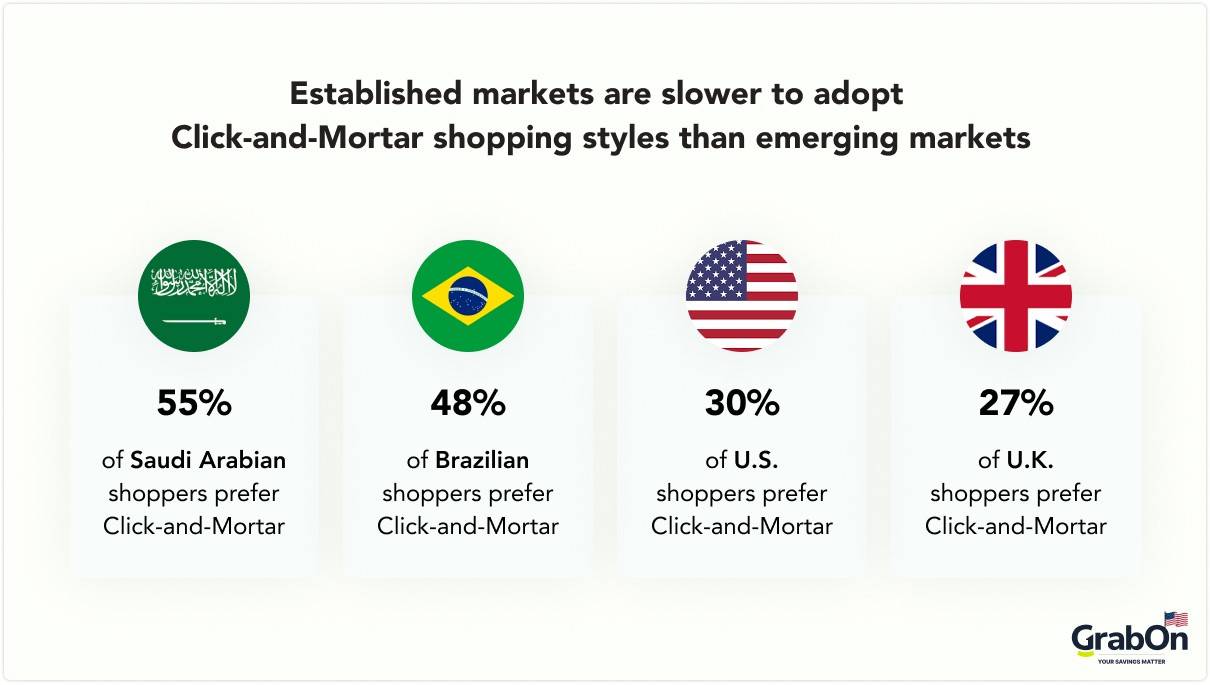
- Saudi Arabia (55%) and Brazil (48%) show higher adoption rates for Click and Mortar shopping as compared to developed markets like the US (30%) and the UK (27%).
- Retailers having 4.7 more digital features are likely to get more revenue growth. The more digital features you offer, the happier customers will be.
The success of merchants depends on how effectively they can combine physical and digital features to offer higher consumer satisfaction. Brands that embrace the hybrid approach and evolve accordingly will grow more in the coming years.
Source: Global Digital Shopping Index 2024 (Visa)
Wrapping Up
While in-store sales revenue is still higher than online shopping revenue, online shopping is growing at a fast pace. By 2040, it is expected that 95% of consumers will make purchases online. Fifteen years from now, there will be a new generation shopping online, and that's going to change the shopping preferences. Both online and in-store shopping will still be a part of the landscape, but they will go hand in hand. Brands must adapt to this change if they want to satisfy their customers and keep growing.