57+ Halloween Spending Statistics (2024 Trends)
Americans spent over $964.4 billion during the holiday season last year, with Halloween sales contributing $12.2 billion, about 1.26% of the total. As the 7th most celebrated holiday in the United States, Halloween sales are expected to account for $15 billion in 2024.
7 out of 10 US citizens plan to celebrate Halloween in 2024 and over half intend to increase their Halloween budget.
In this blog, we explore the latest Halloween spending statistics and analyze various shopping behaviors and trends. We will also discover how consumers plan their Halloween purchases, what influences their spending decisions, and other factors.
Top Halloween Spending Statistics in 2024
- The Halloween expenditure is projected to be $15 billion in 2024, a 22.95% increase from the previous year.
- The average US shopper spends around $108.24 during their Halloween shopping.
- Americans spend $4.1 billion on Halloween costumes, accounting for 33.6% of total Halloween sales.
- About 68% of US consumers make their Halloween purchases from offline stores.
- Californians purchase over 1.2 million pounds of Reese’s Peanut Butter Cups during Halloween.
- About half of Americans are likely to carve a pumpkin for Halloween.
Halloween Spending User Demographics
Halloween is one of the most anticipated holidays for Americans as majority of them plan to celebrate it. Women shoppers in the United States are more excited to celebrate Halloween than men. However, male consumers spend more than female buyers. Here are some of the other key Halloween spending user demographics:
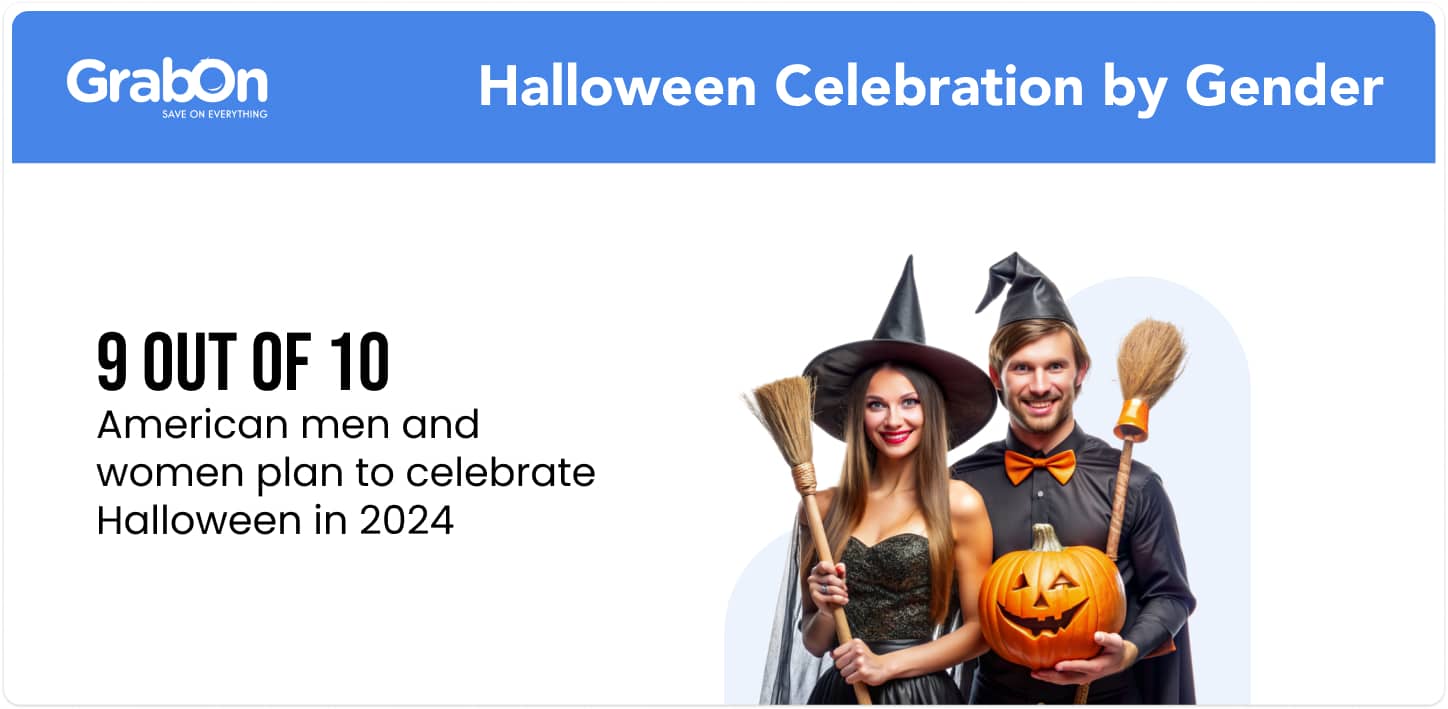
- 86% of male shoppers in the United States plan to celebrate Halloween this year, compared to 91% of female buyers.
- Around 34% of men and 39% of women consider Halloween as an important shopping period for their household.
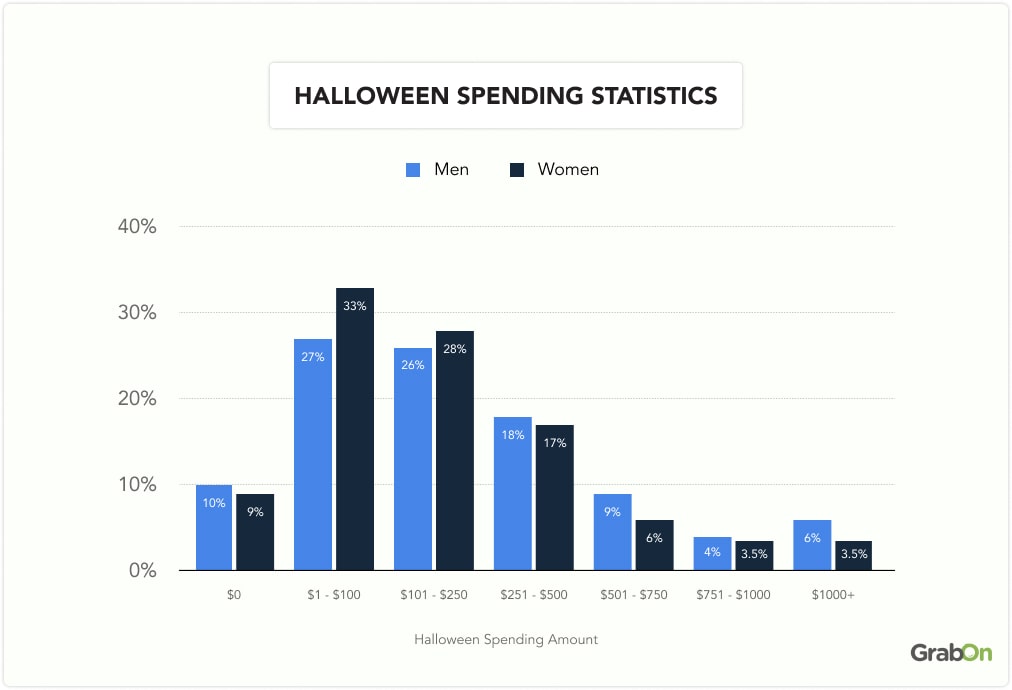
- 3 out of 10 American women will spend around $100 for Halloween shopping, compared to 27% of men. Only 6% of men and 3.5% of women will spend over $1,000 on Halloween purchases.
Here is the table to showcase the average Halloween spending by gender:
| Halloween Spending Amount | Men | Women |
| $0 | 10% | 9% |
| $1 – $100 | 27% | 33% |
| $101 – $250 | 26% | 28% |
| $251 – $500 | 18% | 17% |
| $501 – $750 | 9% | 6% |
| $751 – $1000 | 4% | 3.5% |
| $1000+ | 6% | 3.5% |
- 9 out of 10 Gen Z and millennials in the United States are looking forward to spending on Halloween shopping this year. Meanwhile, 83% of Gen X and 67% of baby boomers plan to join the festivities.
- 5% of American Gen Z shoppers plan to spend over $1000 during their Halloween shopping, compared to 4% of millennials and 2% of Gen X buyers. Baby boomer consumers in the United States plan to limit their Halloween spending to under $1000.
The table below shows the average Halloween spending by age group:
| Halloween Spending Amount | Gen Z | Millennials | Gen X | Baby Boomers |
| $0 | 7% | 5% | 11% | 23% |
| $1 – $100 | 32% | 28% | 36% | 47% |
| $101 – $250 | 26% | 30% | 27% | 19% |
| $251 – $500 | 17% | 20% | 15% | 8% |
| $501 – $750 | 8% | 8% | 6% | 8% |
| $751 – $1000 | 5% | 4% | 3% | 2% |
| $1000+ | 5% | 4% | 2% | 0% |
Source: PowerReviews
Halloween Spending Statistics
The US dominates in the annual Halloween spending over other countries. A majority of buyers in the country spend a significant portion of their Halloween budget on purchasing costumes compared to decorative items, candies, etc. Here are some of the key Halloween spending statistics you should know:
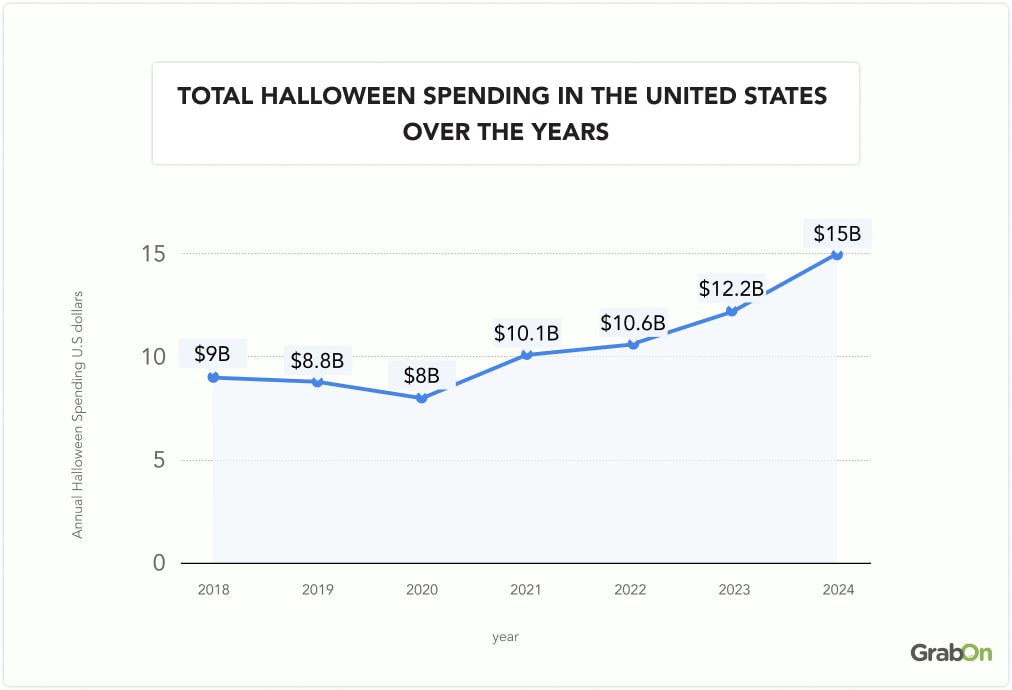
- Americans spent over $12.2 billion on their Halloween shopping in 2023, which is a 15.09% increase from the previous year. It is estimated that Halloween spending will cross $15 billion in 2024.
Let’s check the total Halloween spending in the United States over the years:
| Year | Annual Halloween Spending | Year-on-Year Change |
|---|---|---|
| 2024* | $15 billion* | 22.95%* |
| 2023 | $12.2 billion | +15.09% |
| 2022 | $10.6 billion | +4.95% |
| 2021 | $10.1 billion | +26.25% |
| 2020 | $8 billion | -9.09% |
| 2019 | $8.8 billion | -2.22% |
| 2018 | $9 billion | – |
- Halloween spending accounts for about 1.26% of the US’s total holiday expenditure of $964.4 billion.
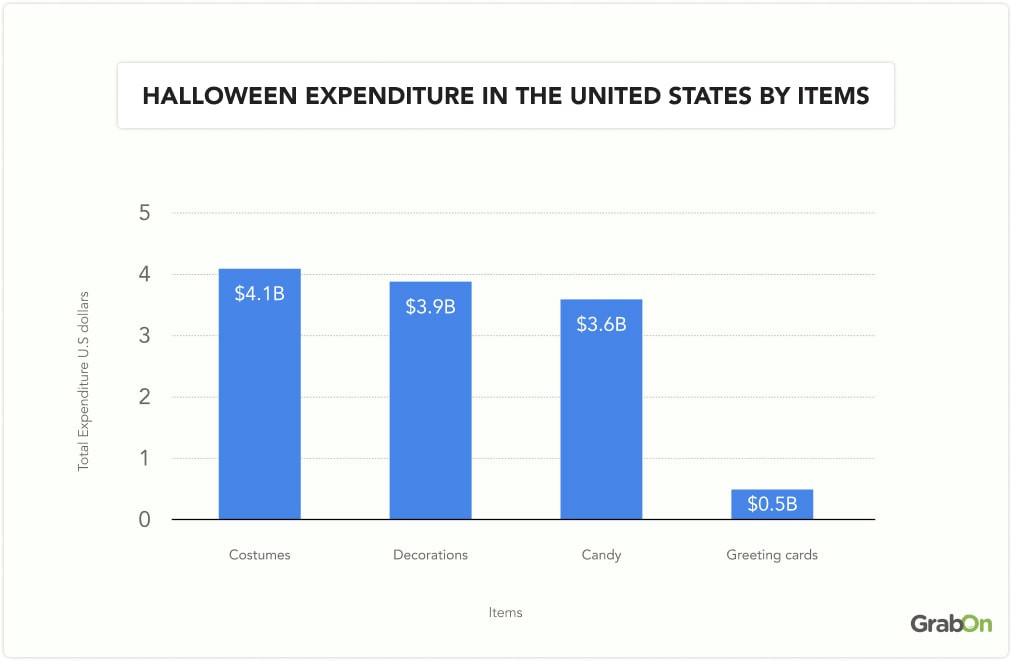
- Halloween shoppers in the U.S. spend about $4.1 billion on costumes, accounting for around 33.6% of the country's total Halloween spending.
- Consumers spend around $3.9 billion and $3.6 billion on buying decoration items and candies, respectively. Americans only spend around $500 million to purchase Halloween greeting cards.
Here is the table to showcase the Halloween expenditure in the United States by items:
| Items | Total Expenditure |
| Costumes | $4.1 billion |
| Decorations | $3.9 billion |
| Candy | $3.6 billion |
| Greeting cards | $0.5 billion |
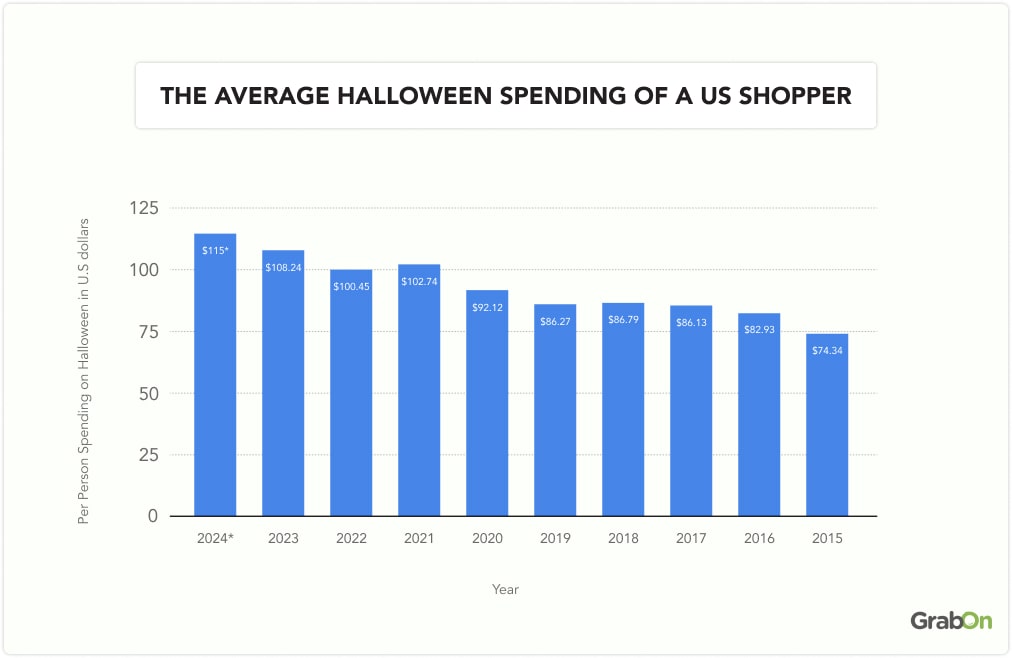
- An average American spent around $108.24 on Halloween shopping in 2023, this is a 7.75% increase from the previous year. It is expected that this amount will cross $115 in 2024.
- The average Halloween expenditure of an American over the last 5 years is around $101.26.
Here is the table to show the average Halloween spending of a US shopper:
| Year | Per Person Spending on Halloween |
| 2024* | $115* |
| 2023 | $108.24 |
| 2022 | $100.45 |
| 2021 | $102.74 |
| 2020 | $92.12 |
| 2019 | $86.27 |
| 2018 | $86.79 |
| 2017 | $86.13 |
| 2016 | $82.93 |
| 2015 | $74.34 |
- An average US shopper spends about 12.5% of their $866 holiday budget on Halloween.
- 5 out of 10 Americans plan to keep their Halloween budget the same as last year, while 14% intend to spend more in 2024. There are around 34% of consumers who plan to reduce their Halloween spending.
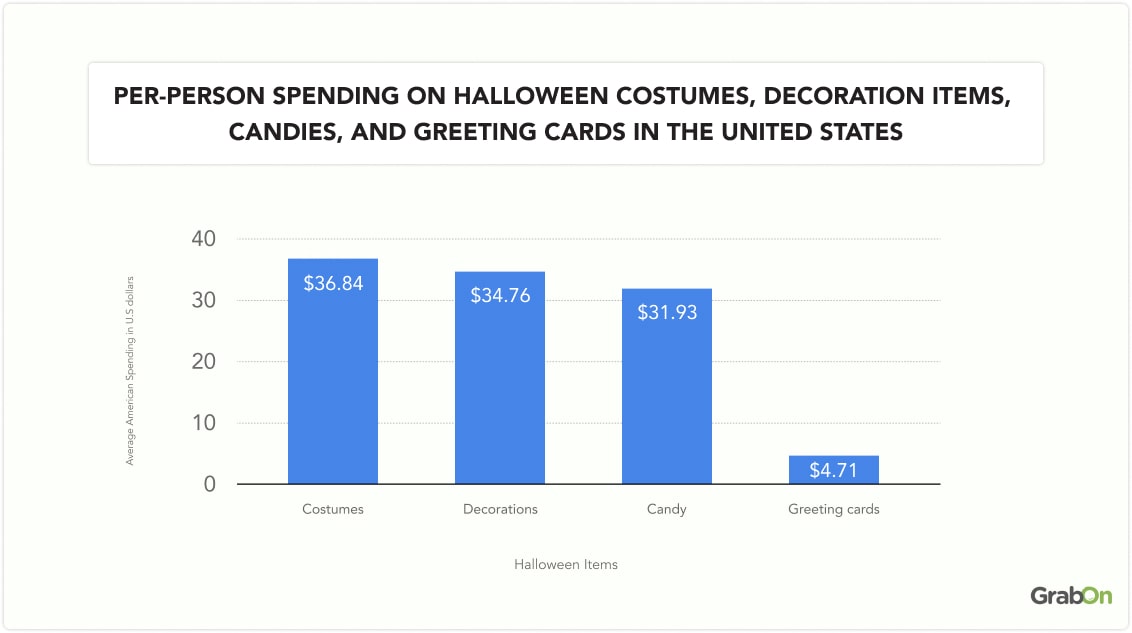
- An average person in the United States spends around $36.84 on Halloween costumes, $34.76 on decoration items, $31.93 on candies, and only $4.71 on greeting cards.
Here is the table to show per-person spending on Halloween costumes, decoration items, candies, and greeting cards in the United States:
| Halloween Items | Average American Spending |
| Costumes | $36.84 |
| Decoration Items | $34.76 |
| Candies | $31.93 |
| Greeting Cards | $4.71 |
- Americans spent about $813.6 billion on Christmas shopping and about $12.2 billion on Halloween shopping. Christmas tops the list of holidays ranked by spending, while Halloween stands at the 7th spot. Mother’s Day and Easter are 2nd and 3rd, with $33.5 billion and $24 billion spent, respectively.
- About half of the United States population decorate their house for Christmas after Halloween.
- Only 3 out of 10 Americans spend a similar amount or more on purchasing Halloween decoration items than Christmas.
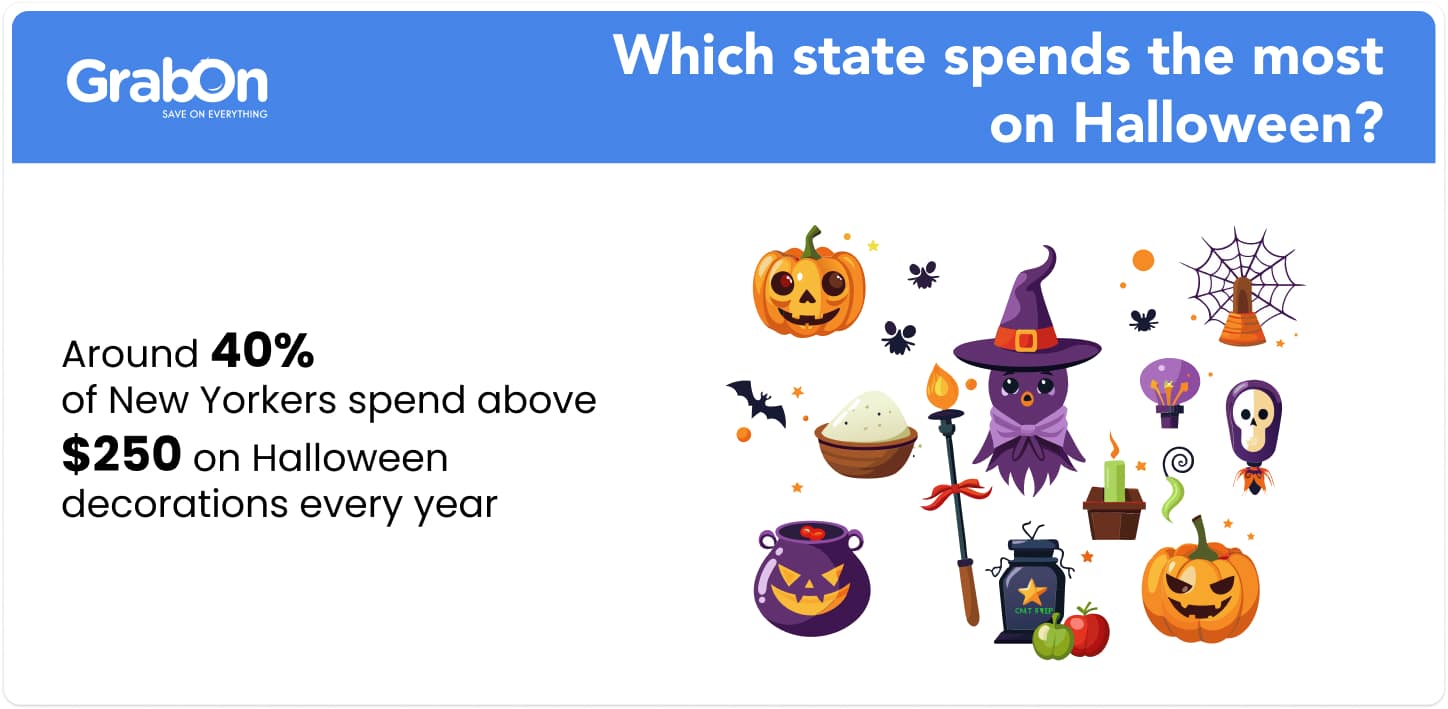
- 4 out of 10 New Yorkers spend $250 to $499 annually on Halloween decorations, making New York the state that spends the most on Halloween. South Dakota follows closely, with 3 out of 10 residents spending the same amount on Halloween shopping.
- Indiana leads in Halloween candy spending, with the average household spending around $20.30 on candies. An average Arkansas household spends around $9 on Halloween candies, the lowest in the United States.
Source: NRF 1, NRF 2, CNBC, Statista 1, Statista 2, Fox News, Angi, Fox59
Halloween spending in the United States versus the United Kingdom
Attitude Toward Halloween and Its Celebration in the US and UK
In the US, Halloween holds a strong place in festive traditions, with 87% of respondents seeing it as worth celebrating, compared to a lighter, but still solid, 66% in the UK. This enthusiasm carries over to participation: 81% of Americans say they'll be celebrating in 2024, with about 65% of Brits joining in the Halloween spirit.
Popular Halloween Activities and How People Plan to Celebrate
While trick-or-treating remains a favorite in both countries, 26% of Americans and 19% of Brits plan to either hand out candy or go out collecting treats. Parties are also popular, with 16% of UK respondents planning to host one and 10% planning to attend, while in the US, 14% plan to attend and 10% to host. For many, Halloween means movie marathons: 26% of Americans and 16% of Brits plan to watch horror movies, though reading horror books is less appealing, with only 1% interested in both countries.
Overview of Halloween Spending Habits Across Both Countries
A significant portion of Brits, around 28%, don't spend anything on Halloween compared to only 11% in the US. Among those who do budget for it, spending trends show UK participants often stick to EGP10-50, whereas Americans typically spend $25-50, with 26% going over $50 for the night's festivities.
Top Halloween Purchases: Candy, Costumes, and Decorations
Candy is the clear favorite purchase in both countries, making up 56% of Halloween spending in the US and 35% in the UK. Costumes and decorations are also high on the shopping list, showing that both Americans and Brits enjoy bringing a festive look and feel to their Halloween celebrations.
Approach to Trick-or-Treating: Treats, Tricks, and Door Policy
When it comes to handling trick-or-treaters, most respondents lean toward treats over tricks, with 61% in the US and 54% in the UK opting to hand out candy. A smaller group, 7% in the US and 4% in the UK, prefer giving out tricks instead. Interestingly, more Brits (27%) plan to avoid opening their doors to trick-or-treaters compared to Americans (16%), adding a bit of contrast to how each country approaches the tradition.
Source: Cint
Halloween Shopping Statistics
A majority of Americans are most likely to do their Halloween shopping from offline stores. Reports also suggested that shoppers are also planning to use the BOPIS method during Halloween sales. Below we have listed some of the key Halloween shopping statistics you should know:
- 7 out of 10 Americans are planning to celebrate Halloween with their friends and family this year. This is a 5.8% increase from the previous year.
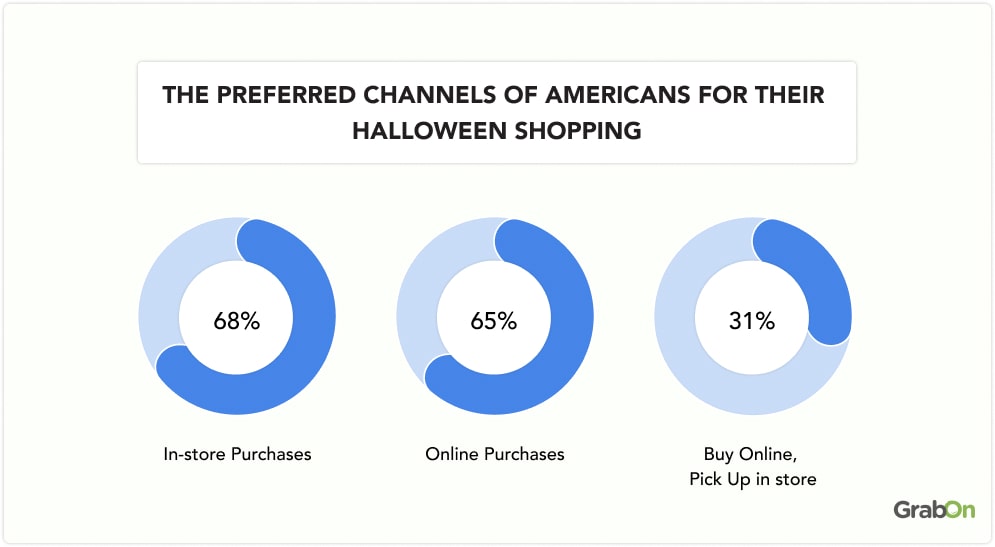
- 7 out of 10 US shoppers plan to do their Halloween shopping in offline stores, while 65% of them will opt for online shopping.
- Only 3 out of 10 Americans are considering the BOPIS model, where they order online and pick up in-store.
The table below shows the preferred channels of Americans for their Halloween shopping:
| Mode of Shopping | Share of Americans opting |
| In-store Purchases | 68% |
| Online Purchases | 65% |
| Buy Online, Pick Up in store | 31% |
- 3 out of 10 Americans start their Halloween shopping as early as September. Another 15.78% of shoppers chose to start shopping in the first 2 weeks of October. While over 10% of them like to do their Halloween shopping last minute.
Let's check when Americans start their Halloween shopping:
| Time when Americans to start their Halloween Shopping | Share of Americans chose their Halloween Shopping |
| Look for sales after Halloween for next year | 7.95% |
| Throughout the year | 12.29% |
| In September | 28.55% |
| The first 2 weeks of October | 15.78% |
| The last 2 weeks of October | 8.07% |
| Last minute | 10% |
| Depends on what they are looking for/have planned | 17.35% |
- 4 out of 10 Americans shop for Halloween at discount stores, while 39% prefer costume stores for most of their Halloween purchases. Another 28% of shoppers opt to purchase from grocery stores or supermarkets.
The table below shows what retail stores Americans use the most for their Halloween shopping:
| Retail Stores | Share of Americans Choosing |
| Discount store | 40% |
| Specialty Halloween/costume store | 39% |
| Online | 32% |
| Grocery store/supermarket | 28% |
| Department store | 25% |
| Clothing store | 13% |
| Crafts of Fabrics store | 13% |
| Home decor store | 13% |
| Thrift stores/resale shops | 12% |
| Local/small business | 10% |
| Greeting card/gift store | 8% |
| Home improvement store | 8% |
| Drug store | 8% |
| Catalog | 3% |
| Other | 4% |
- Over half of the Gen Z shoppers in the United States chose to shop at costume stores during Halloween. Another 43% of them do most of their shopping online and only 14% opt for local businesses.
- 4 out of 10 US consumers get inspired to do their Halloween shopping through online searches, while 28% get inspired after visiting retail stores or costume stores. Another 20% of them do their shopping after talking with their friends and family members.
Source: PowerReviews, Statista 1, Statista 2, Statista 3
Halloween Candy Spending Statistics
Candies are the third most purchased product by US consumers during their Halloween shopping after costumes and decoration items. According to some reports, consumers are expected to increase their spendings on candies this year. Let’s check some of the most interesting Halloween candy spending statistics:
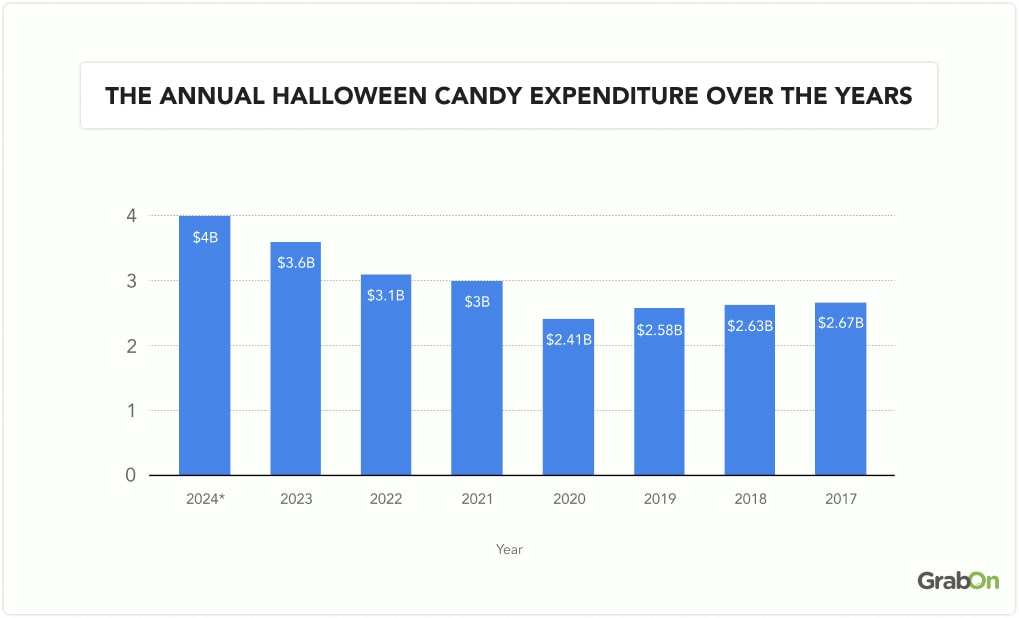
- Americans spent around $3.6 billion on purchasing candies during Halloween in 2023, this is a 16.13% increase from the last year. It is expected that the total Halloween candy spending will cross $4 billion in 2024.
The table below shows the annual Halloween candy expenditure over the years:
| Years | Annual Halloween Candy Expenditure |
| 2024* | $4 billion* |
| 2023 | $3.6 billion |
| 2022 | $3.1 billion |
| 2021 | $3 billion |
| 2020 | $2.41 billion |
| 2019 | $2.58 billion |
| 2018 | $2.63 billion |
| 2017 | $2.67 billion |
- Halloween candy makes up about 29.51% of total Halloween spending each year. Another report suggested that around 96% of American households purchase candy for Halloween.
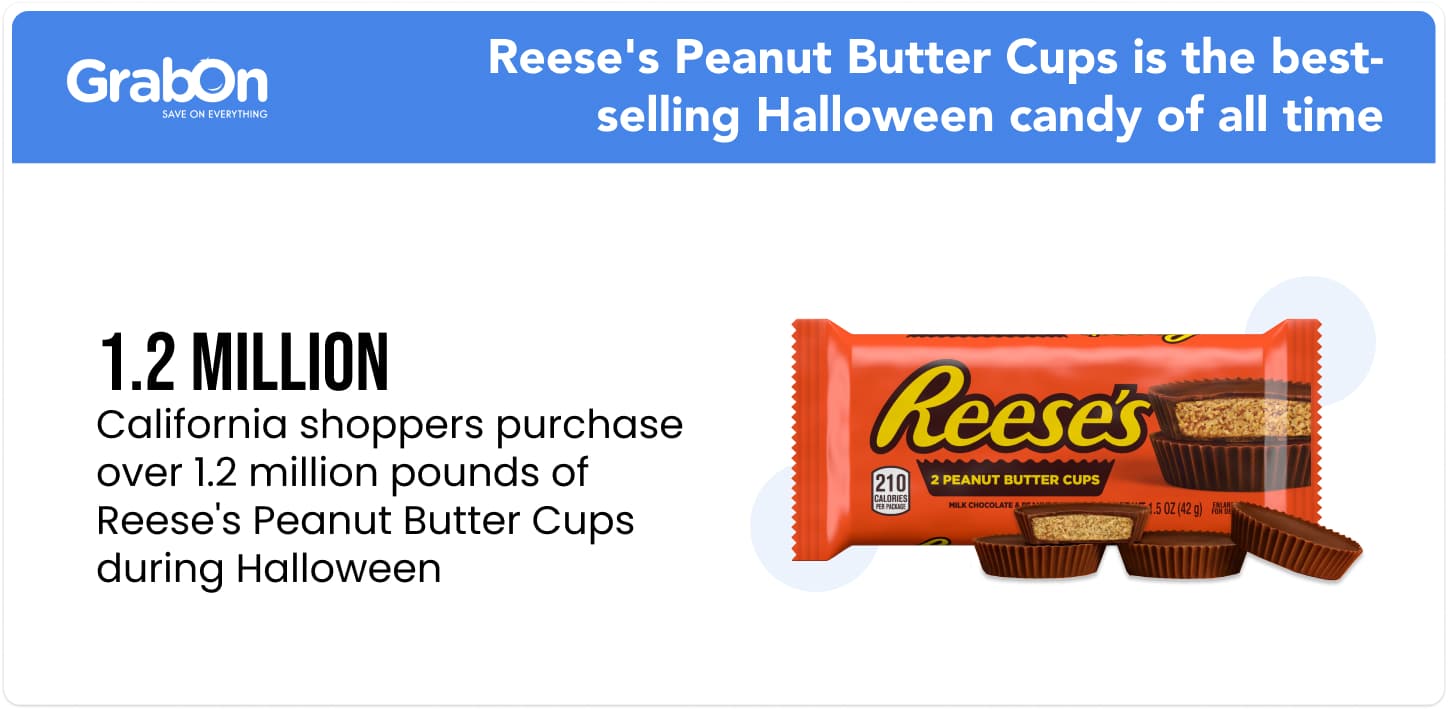
- Reese’s Peanut Butter Cups is the most purchased Halloween candy in the history of the United States. It is the best-selling candy in 18 states of the country.
- 10 states of the United States ordered around 3.35 million Reese’s Peanut Butter Cups during Halloween last year.
- California consumers purchased around 1,204,345 pounds of Reese’s Peanut Butter Cups for Halloween the previous year, followed by Texas with 908,876 pounds.
- Here are the top 10 Halloween candies in the United States:
- Reese’s Peanut Butter Cups
- Peanut MandM’s
- Regular MandM’s
- Tootsie Pops
- Twizzlers
- Hershey’s Milk Chocolate
- Sour Patch Kids
- Candy Corn
- KitKat
- Starburst
Source: NRF, CandyStore
Halloween Costume Spending Statistics
Costumes are the most sold product in the United States during Halloween. A majority of Americans prefer purchasing Halloween costumes from online stores specifically from Amazon. Pet lovers in the country also spend a significant amount on Halloween costumes for their prts. Here are some of the key Halloween costume spending statistics that you must know:
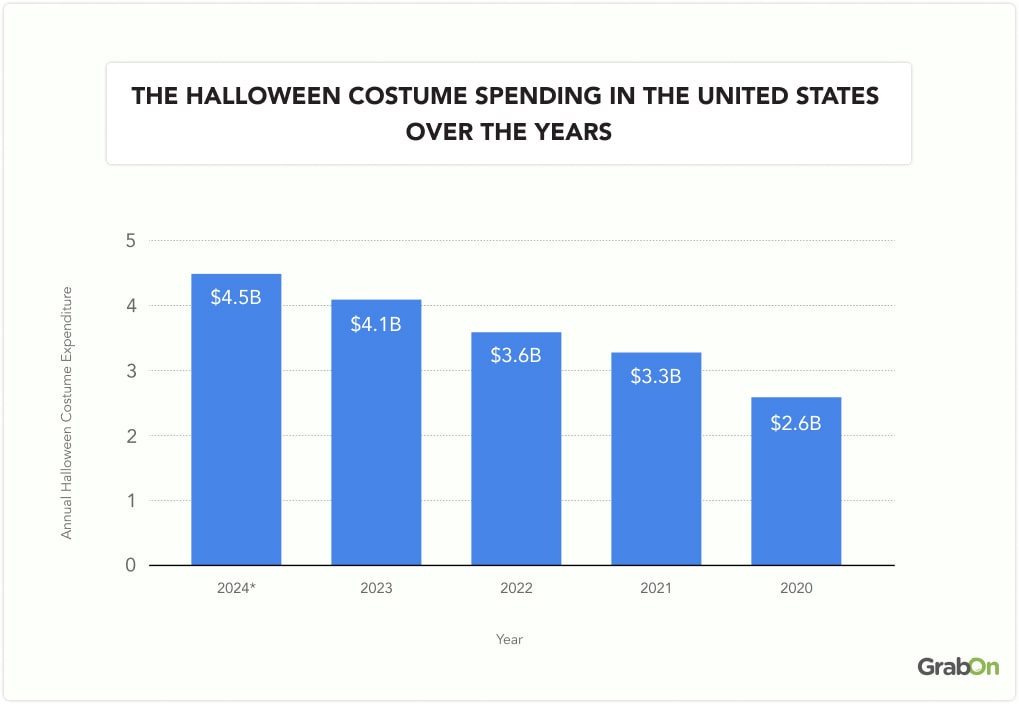
- US consumers spent around $4.1 billion on purchasing costumes during Halloween in 2023, this is a 13.89% increase from the previous year. It is projected that the annual Halloween costume sales will cross $4.5 billion in 2024.
The table below shows the Halloween costume spending in the United States over the years:
| Year | Annual Halloween Costume Expenditure |
| 2024* | $4.5 billion |
| 2023 | $4.1 billion |
| 2022 | $3.6 billion |
| 2021 | $3.3 billion |
| 2020 | $2.6 billion |
- An average American spends around $36.84 on Halloween costumes each year. This is around 1/3rd of their overall Halloween budget.
- American pet lovers spend a whopping $700 million purchasing pet costumes annually.
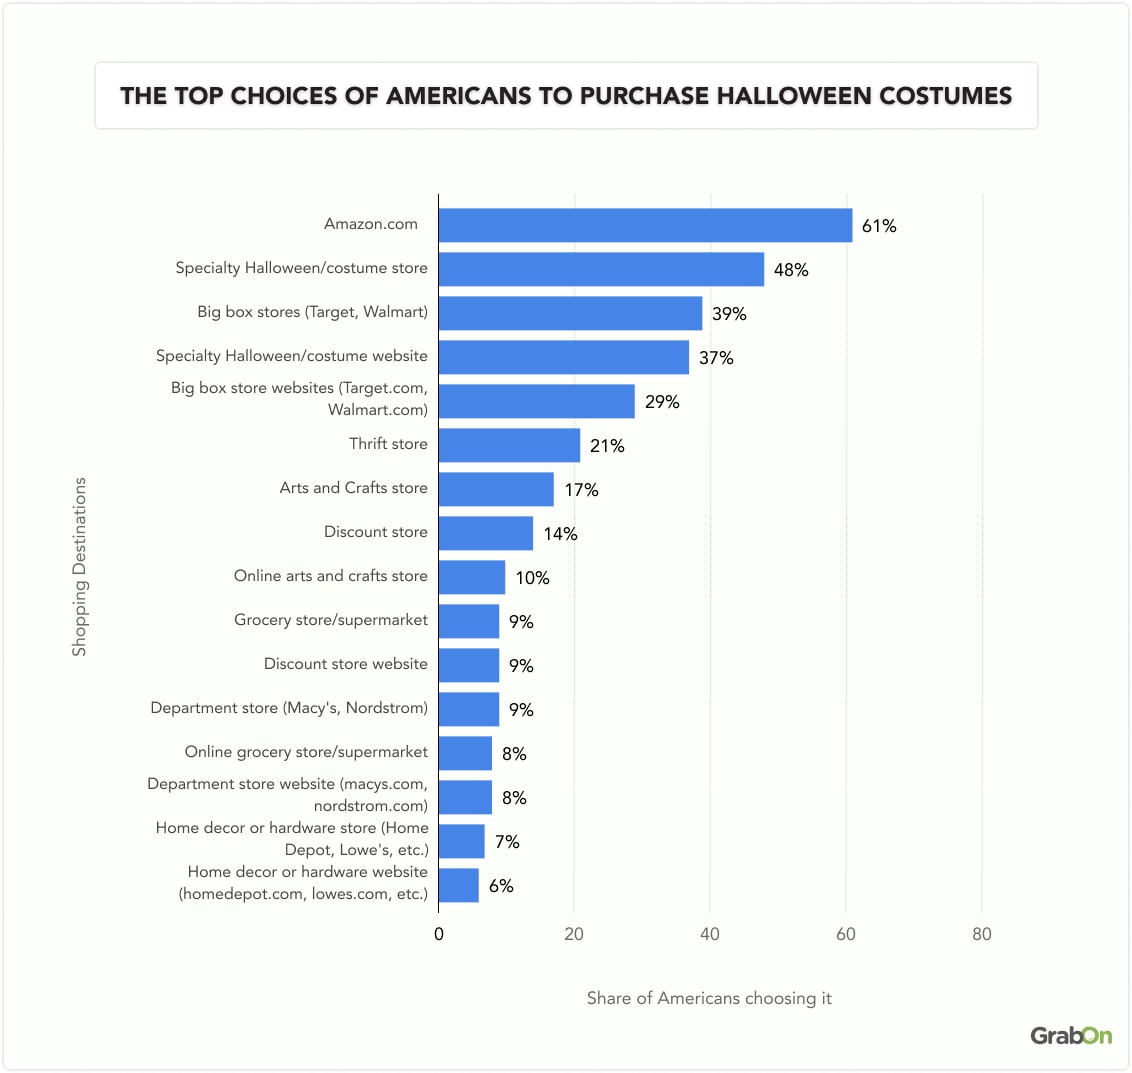
- 6 out of 10 US consumers prefer buying Halloween costumes from Amazon, while about half opt for costume stores. Another 39% of Americans prefer to get their costumes from big box stores, like Target and Walmart.
- Only 9% of shoppers tend to purchase Halloween costumes from supermarkets, discount stores, and department stores, like Macys.com.
The table below shows the top choices of Americans to purchase Halloween costumes:
| Shopping Destinations | Share of Americans choosing it |
| Amazon.com | 61% |
| Specialty Halloween/costume store | 48% |
| Big box stores (Target, Walmart) | 39% |
| Specialty Halloween/costume website | 37% |
| Big box store websites (Target.com, Walmart.com) | 29% |
| Thrift store | 21% |
| Arts and Crafts store | 17% |
| Discount store | 14% |
| Online arts and crafts store | 10% |
| Grocery store/supermarket | 9% |
| Discount store website | 9% |
| Department store (Macy’s, Nordstrom) | 9% |
| Online grocery store/supermarket | 8% |
| Department store website (macys.com, nordstrom.com) | 8% |
| Home decor or hardware store (Home Depot, Lowe’s, etc.) | 7% |
| Home decor or hardware website (homedepot.com, lowes.com, etc.) | 6% |
- Witch is the most popular Halloween costume for US adults followed by Vampire, Barbie, and Batman. Here are the top 10 Halloween costumes for adults in the United States:
- Witch
- Vampire
- Barbie
- Batman
- Cat
- Zombie
- Pirate
- Princess
- Ghost
- Spiderman
- Kids love wearing Spiderman costumes for Halloween, followed by Princess, Ghost, and Superheroes. Here are the top 10 Halloween costumes for children in the United States:
- Spiderman
- Princess
- Ghost
- Superhero
- Witch
- Batman
- Barbie
- Zombie
- Mario
- Wednesday Addams
- Pet lovers in the United States purchased Pumpkin Halloween costumes for their pets, making them the best-selling ones. It is followed by Hot Dog, Bat, and Bumblebee, in the 2nd, 3rd, and 4th spots, respectively. Here are the top 10 Halloween costumes for pets in the United States:
- Pumpkin
- Hot dog
- Bat
- Bumblebee
- Spider
- Devil
- Cat
- Lion
- Ghost
- Witch
Halloween Decor Spending Statistics
Decoration items are the second most sold products during Halloween in the United States. Most of the Americans prefer purchasing Halloween decoration items from big box stores. Among all the decorative items, people love to use pumpkin carvings the most. Here are some key Halloween decor spending statistics you should check:
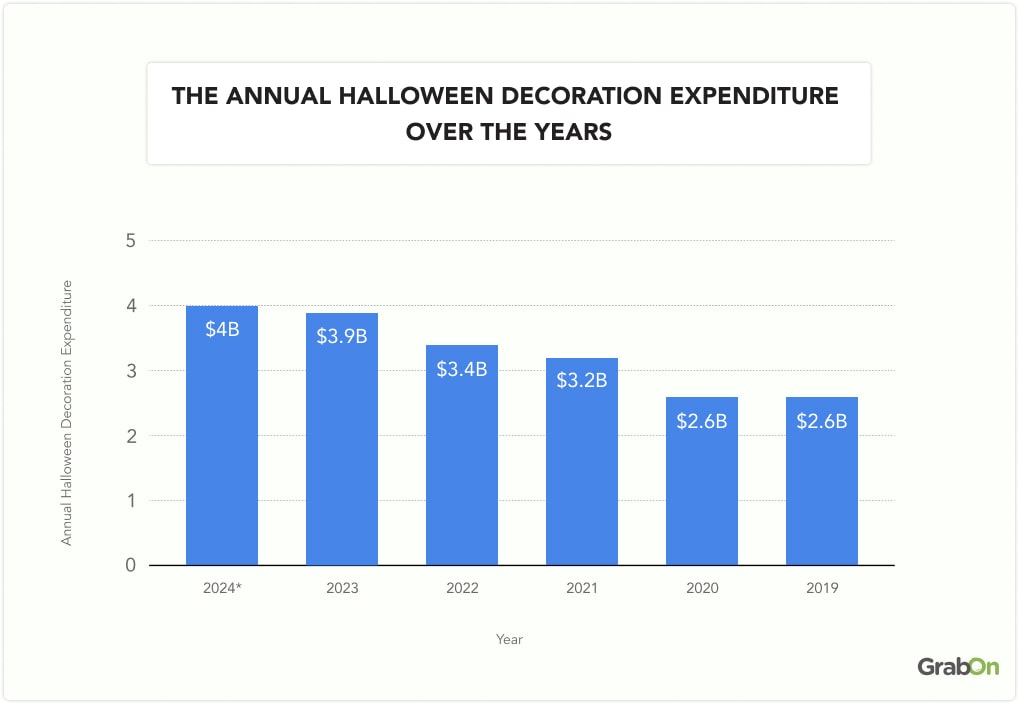
- Americans spent over $3.9 billion in purchasing decoration items during Halloween in 2023, this is a 14.71% increase from the last year. It is expected that the annual Halloween decoration expenditure will cross $4 billion in 2024.
The table below shows the annual Halloween decoration expenditure over the years:
| Year | Annual Halloween Decoration Expenditure |
| 2024* | $4 billion* |
| 2023 | $3.9 billion |
| 2022 | $3.4 billion |
| 2021 | $3.2 billion |
| 2020 | $2.6 billion |
| 2019 | $2.6 billion |
- Annual Halloween decoration spending makes up about 32% of the total Halloween expenditure of $12.2 billion.
- An average American spends around $34.76 on purchasing decoration items during Halloween. Upon calculation, we can conclude that an average US consumer spends about 32.14% of their Halloween budget on decorations.
- More than half of Americans buy Halloween decorations from big box stores like Target and Walmart, while 51% prefer shopping on Amazon.com.
- Around 30% of shoppers visit big box store websites, like Target.com and Walmart.com to get their preferred decoration items for Halloween.
Here is the table to showcase the popular destinations for Americans for Halloween decor shopping:
| Popular Shopping Destinations | Share of Americans choosing it |
| Big box stores (Target, Walmart) | 54% |
| Amazon.com | 51% |
| Big box store websites (Target.com, Walmart.com) | 30% |
| Discount store | 24% |
| Arts and Crafts store | 23% |
| Home decor or hardware store (Home Depot, Lowe’s, etc.) | 22% |
| Grocery store/supermarket | 19% |
| Thrift store | 15% |
| Home decor or hardware website (homedepot.com, lowes.com, etc.) | 14% |
| Online grocery store/supermarket | 11% |
| Online arts and crafts store | 11% |
| Discount store website | 9% |
| Department store (Macy’s, Nordstrom) | 8% |
| Department store website (macys.com, nordstrom.com) | 7% |
- Around 46% of the US people prefer to celebrate Halloween by carving a pumpkin. This is a 4.55% increase from the previous year.
- The cost of pumpkins was $5.24 in 2023, this is a 2.96% decrease in price from the previous year. This is the first after 2018, that the price of pumpkins has decreased.
- Americans spent around $843,590,004 on Jack-o-Lantern during Halloween in 2023, this is a 12.30% increase from the previous year.
Source: NRF, Power Reviews, Finder, Statista
Conclusion
Halloween expenditure in the United States has been on the rise in the past few years and is projected to cross the $15 billion mark in 2024. This will directly impact the overall retail sales in the country. Along with the Halloween spending, the number of Americans planning to celebrate Halloween is also increasing. This year around 70% of US people are planning to celebrate Halloween; retailers and brands must look for new strategies to improve their Halloween sales by attracting more consumers.
