Google Ads And PPC Statistics (2025)
Google Ads began its journey in October 2000 as Google AdWords, a simple platform offering text-based ads. Back then, businesses could target users based on search queries, allowing them to connect with potential customers. What started with just 350 advertisers has now evolved into a multi-billion-dollar global platform.
Today, Google Ads offers a wide array of advertising solutions, from search and display ads to shopping and video ads, reaching billions of users worldwide. In 2024, Google Ads generated $72,461 million, showing its dominance and effectiveness in the digital advertising market.
Google Ads Statistics (Top Picks)
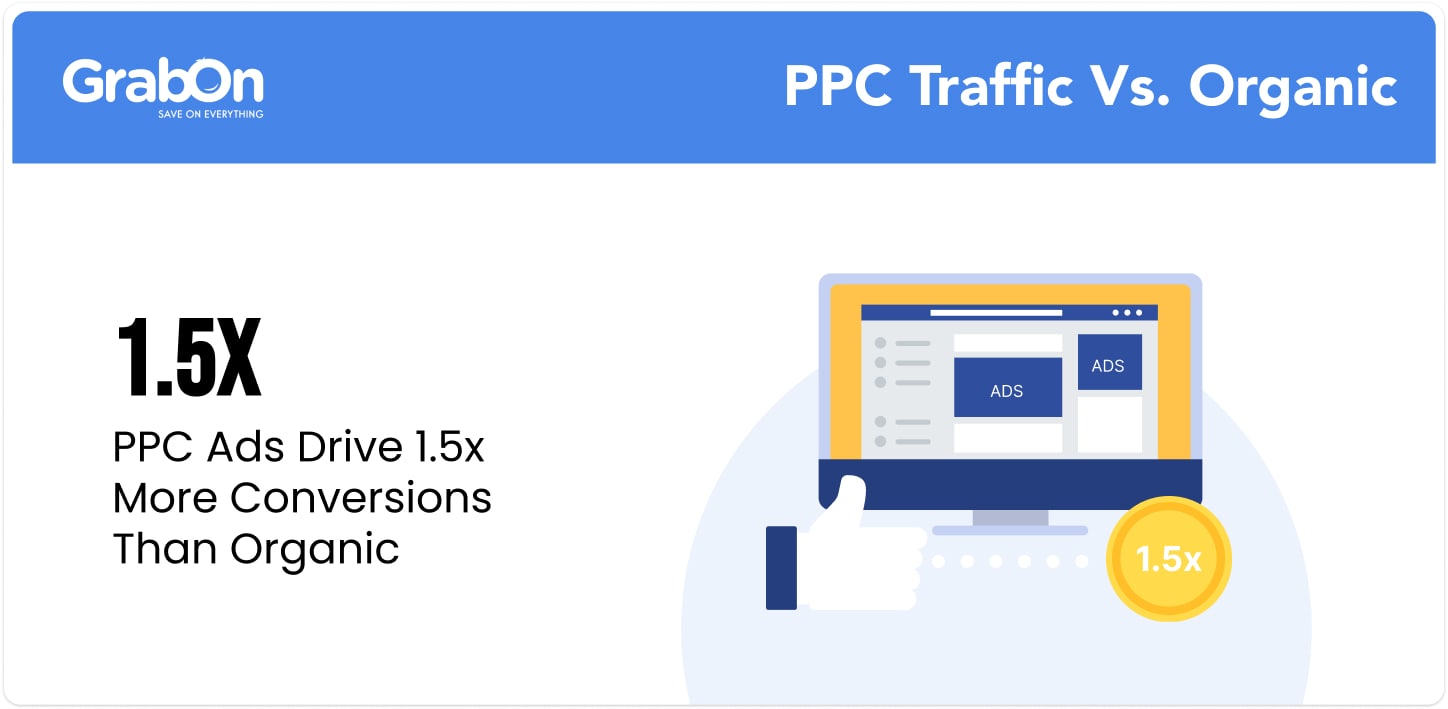
- PPC-driven traffic converts 50% more effectively than organic traffic.
- 80% of businesses worldwide use Google Ads.
- Google holds 91.47% of the global search engine market share as of 2024.
- In Q2 2024, Google Ads generated $64.6 billion in revenue.
- The average cost per click in Google Ads in 2024 is $0.94$1.88 with Attorneys and Legal Services averaging $8.94 per click.
| Google Ads Glossary
Pay-Per-Click (PPC) An advertising model where you pay each time someone clicks on your ad. Click-Through Rate (CTR) The percentage of people who click on your ad after seeing it. Conversion Rate (CVR) The percentage of people who take a desired action (like making a purchase) after clicking on your ad. Cost Per Click (CPC) The amount you pay each time someone clicks on your ad. Cost Per Lead (CPL) The amount you pay to acquire a potential customer who shows interest in your product or service. |
General PPC Statistics
PPC advertising is known to be highly effective, with PPC-driven traffic converting 50% more effectively than organic traffic. Notably, PPC ads can increase brand awareness by up to 80% and deliver an impressive average ROI of 200%. The reach of these ads is vast, with Google Display Network ads engaging up to 90% of all internet users.
Additionally, 52% of PPC clicks originate from mobile devices. On average, small to medium-sized businesses allocate between $9,000 and $10,000 monthly to PPC campaigns.
Sources: Sixth City Marketing, WebFX, Moz, Hubspot
Google Search Ads Statistics
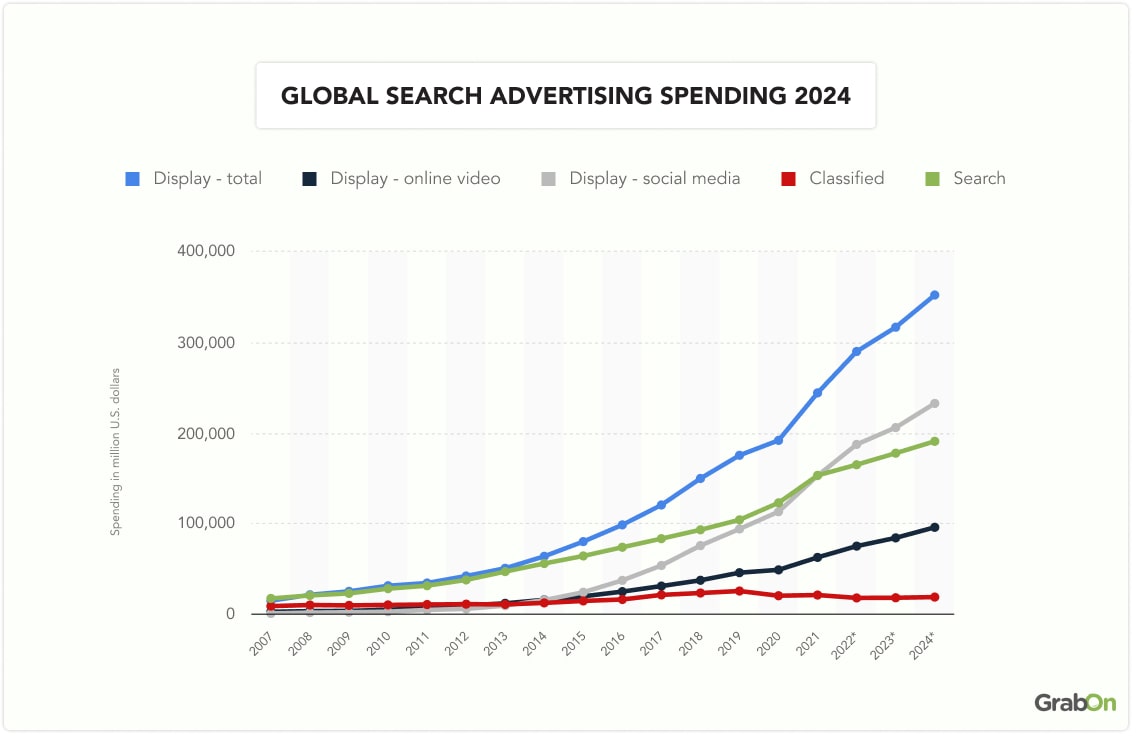
80% of businesses worldwide use Google Ads, with only a limited number of spots available for ads on the search engine results page (SERP). Search advertising spending is projected to reach $190.5 billion globally in 2024, with paid search making up nearly 39% of advertisers’ budgets.
Source: Statista
Google's Search Engine Market Share
As of March 2025, Google leads the global search engine market, holding 89.71% of the market share. This positions Google well ahead of its closest competitor, Bing, with 4.01% of the market share. Other search engines, including Yahoo!, Yandex, DuckDuckGo, and Baidu, collectively account for 5.25% of the market.
Below's a table highlighting the market share of different search engines as of 2024:
| Search Engine | Market Share |
| 89.71% | |
| Bing | 4.01% |
| YANDEX | 2.51% |
| Yahoo! | 1.33% |
| DuckDuckGo | 0.79% |
| Baidu | 0.62% |
In the UK, Google’s dominance is even more pronounced, with a market share of 93.24%. Despite some minor fluctuations, Google's global market share has consistently remained above 75% over the past year, leading the search engine market.

Source: Statista
Google Ads Market Share
As of 2024, Google holds 25.6% of the US digital advertising market, well ahead of Meta's 21.3% and Amazon's 13.9%. Despite a forecasted drop to 24.6% in 2025 and 23.9% in 2026, Google's dominance remains strong.
From 2021 to 2023, Google’s market share decreased from 28.4% to 26.8%. Even with this decline, Google remains significantly ahead of Amazon, which is expected to reach 17.3% by 2026.
Explore the table to see how Google Ads' market share comparison from 2021 to 2026*
| Year | Meta | Amazon | Microsoft | TikTok | |
| 2026* | 23.9% | 20.9% | 17.3% | 3.5% | 4.1% |
| 2025* | 24.6% | 21.1% | 15.4% | 3.5% | 3.7% |
| 2024 | 25.6% | 21.3% | 13.9% | 3.6% | 3.4% |
| 2023 | 26.8% | 21.1% | 12.5% | 3.6% | 2.8% |
| 2022 | 28.6% | 20.5% | 11.4% | 3.7% | 2.1% |
| 2021 | 28.4% | 23.2% | 10.7% | 3.6% | 1.0% |
Source: Statista
Google Ads Revenue Statistics
In Q4 2024, Google Ads generated a revenue of $72,461 million, marking an increase from the $61,659 million reported in Q1 2024. Google Ads revenue grew by approximately 17.5% from Q1 2024 to Q4 2024. Despite a 5.9% drop in Q1 2024 from the previous quarter, Google Ads revenue grew by approximately 10.6% year-on-year from Q4 2023 to Q4 2024.
Explore the table below for the latest quarter-on-quarter revenue figures for Google Ads:
| Quarter | Revenue |
| Q1 2023 | $54,548 million |
| Q2 2023 | $58,143 million |
| Q3 2023 | $59,647 million |
| Q4 2023 | $65,517 million |
| Q1 2024 | $61,659 million |
| Q2 2024 | $64,616 million |
| Q4 2024 | $72,461 million |
Source: Alphabet Investor Relations
Google’s Annual Ad Revenue Growth
In 2024, Google Ads generated $264.59 billion which was a 11.24% jump from last year.
$237.86 billion was generated by Google Ads in 2023. representing 77.8% of Google’s total revenue of $305.63 billion. This reflects a 5.95% rise from 2022 when ad revenue was $224.47 billion. Google also allocated 68% of its ad revenue to publishers and retained a dominant 73% share of the paid search market.
Google's ad revenue surged by $117.67 billion, representing an increase of approximately 80.1% from 2020 to 2024.
The table below shows Google's impressive growth in advertising revenue over the years:
| Year | Advertising Revenue (US dollars) |
| 2024 | $264.59 billion |
| 2023 | 237.86 billion |
| 2022 | 224.47 billion |
| 2021 | 209.49 billion |
| 2020 | 146.92 billion |
| 2019 | 134.81 billion |
| 2018 | 116.46 billion |
| 2017 | 95.58 billion |
| 2016 | 79.38 billion |
| 2015 | 67.39 billion |
| 2014 | 59.62 billion |
| 2013 | 51.07 billion |
| 2012 | 43.69 billion |
| 2011 | 36.53 billion |
Source: Statista
Google Ads CTR Statistics

The Arts and Entertainment sector leads with an impressive 13.04% CTR, followed by Sports and Recreation at 9.66% and Real Estate at 9.20%. On the lower end, Attorneys and Legal Services have the lowest average CTR at 5.30%, with Home and Home Improvement at 5.59% and Dentists and Dental Services at 5.38%.
Notably, the top 3 paid ads on Google search results pages catch 41% of all clicks.
Explore the table below to discover which industries achieve the highest CTR with Google Ads:
| Business Category | Avg. CTR |
| Animals and Pets | 7.39% |
| Apparel / Fashion and Jewelry | 6.13% |
| Arts and Entertainment | 13.04% |
| Attorneys and Legal Services | 5.30% |
| Automotive For Sale | 8.58% |
| Automotive Repair, Service and Parts | 5.69% |
| Beauty and Personal Care | 6.75% |
| Business Services | 5.62% |
| Career and Employment | 6.79% |
| Dentists and Dental Services | 5.38% |
| Education and Instruction | 6.21% |
| Finance and Insurance | 7.71% |
| Furniture | 6.50% |
| Health and Fitness | 6.88% |
| Home and Home Improvement | 5.59% |
| Industrial and Commercial | 5.83% |
| Personal Services | 7.95% |
| Physicians and Surgeons | 6.73% |
| Real Estate | 9.20% |
| Restaurants and Food | 8.68% |
| Shopping, Collectibles and Gifts | 7.81% |
| Sports and Recreation | 9.66% |
| Travel | 10.16% |
Source: WordStream
Cost Per Click Stats Of Google Ads
However, CPC rates differ widely by industry. For example, competitive sectors like Attorneys and Legal Services average $8.94 per click, while less competitive areas like Arts and Entertainment have a lower CPC of around $1.72.
Industries with higher CPCs, such as Home and Home Improvement at $6.96 and Dentists and Dental Services at $6.82, reflect the intense competition for consumer attention, driving up costs. Conversely, sectors like Travel and Real Estate, with CPCs under $2.10, highlight opportunities for businesses to reach audiences more cost-effectively.
The table below provides a breakdown of the average CPC across various industries:
| Industry | Average CPC (USD) |
| Attorneys and Legal Services | $8.94 |
| Home and Home Improvement | $6.96 |
| Dentists and Dental Services | $6.82 |
| Business Services | $5.37 |
| Health and Fitness | $4.71 |
| Education and Instruction | $4.39 |
| Real Estate | $2.10 |
| Travel | $1.92 |
| Arts and Entertainment | $1.72 |
Source: WordStream
Google Ads Conversion Rate Statistics

Automotive Repair, Service, and Parts lead with an impressive 12.96% CVR, followed closely by Animals and Pets at 12.03%, and Physicians and Surgeons at 11.08%. In contrast, industries like Furniture, Finance and Insurance, and Real Estate saw lower conversion rates, with CVRs below 3.0%.
The table below provides a detailed breakdown of the average CVRs across various industries:
| Business Category | Avg. CVR |
| Automotive Repair, Service and Parts | 12.96% |
| Animals and Pets | 12.03% |
| Physicians and Surgeons | 11.08% |
| Home and Home Improvement | 8.62% |
| Beauty and Personal Care | 8.01% |
| Finance and Insurance | 2.78% |
| Furniture | 2.53% |
| Real Estate | 2.91% |
Source: WordStream
Google Ads Cost Per Lead Statistics

However, this figure varies significantly by industry. Automotive Repair, Service, and Parts had the lowest CPL at $27.94, followed by Restaurants and Food at $29.67, and Animals and Pets at $34.81, highlighting their efficiency in acquiring new customers at a lower cost.
On the other end, Attorneys and Legal Services faced the highest CPL at $144.03, with Furniture at $119.10 and Career and Employment at $117.92, reflecting higher costs to generate leads in these sectors.
Check out the table below to see Google Ads’ Cost Per Lead across different industries:
| Business Category | Avg. CPL |
| Attorneys and Legal Services | $144.03 |
| Career and Employment | $117.92 |
| Furniture | $119.10 |
| Business Services | $105.64 |
| Real Estate | $87.36 |
| Restaurants and Food | $29.67 |
| Automotive Repair, Service and Parts | $27.94 |
| Animals and Pets | $34.81 |
Source: WordStream
Google Shopping Statistics
With 1.2 billion searches each month, Google Shopping offers extensive reach. It outperforms text ads with 30% higher conversion rates and gets 60% of all clicks on Google paid ads, stressing its effectiveness and popularity.
Explore key Google Shopping metrics for effective advertising insights:
| Metric | Value |
| Average Conversion Rate on Google Search Ads | 3.1-6% |
| Average Cost per Lead | $38.87 |
| Average Cost per Click |
$0.94$1.88 |
| Click-Through Rate | 4-6% |
Also Read:
Source: Businessdit, The Social Sheperd
Google Ads Costs
In 2025, Google Ads is still a major investment for businesses, with the average cost per click (CPC) reaching $5.26 and the average cost per lead (CPL) at $70.11. Small and medium-sized businesses typically start with a monthly Google Ads budget ranging from $1,000 to $2,500, while most companies spend between $1,000 and $10,000 per month to maintain effective campaigns.
For new campaigns, daily costs often fall between $20 and $50, reflecting the platform's flexibility but also the need for careful budget management. These figures highlight the importance of strategic planning, as Google Ads costs can vary widely depending on industry, competition, and campaign goals.
Source: Wordstream
Google's Mobile Ad Stats
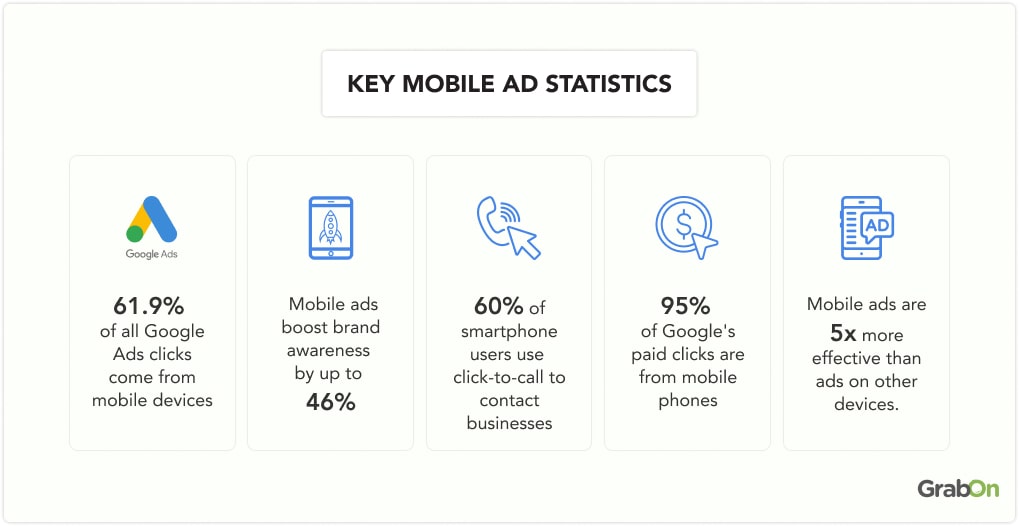
Mobile devices are crucial for Google Ads. They account for 61.9% of all clicks and 95% of paid clicks. Mobile ads increase brand awareness by up to 46% and are five times more effective than ads on other devices. Also, 60% of smartphone users use click-to-call features to contact businesses directly.
Looking Ahead
Google Ads is expected to continue its impressive growth, with global ad spending on the platform projected to exceed $250 billion by 2025. As AI-driven ad targeting advances, it's anticipated that 70% of Google Ads campaigns will be fully automated by 2026, significantly boosting advertiser efficiency and ROI.
Additionally, with the rise of privacy regulations, over 80% of Google Ads will likely incorporate enhanced privacy features by 2025, ensuring compliance and consumer trust. The integration of emerging technologies, such as augmented reality, is predicted to drive a 35% increase in interactive ad formats, further expanding the ways businesses can connect with their audiences.