Starbucks Statistics 2026: Stores, Market Share & Employees

Founded in 1971 at Seattle’s Pike Place Market, Starbucks has expanded from a single store to the world’s largest coffeehouse chain, operating over 41,129 across 80+ countries. The company reported a revenue of $37.2 billion in the previous year and claims to serve approximately 100 million coffee enthusiasts every week.
Starbucks sources its coffee from over 400,000 farmers in 30 countries within the “Bean Belt, emphasizing ethical practices through its Coffee and Farmer Equity (C.A.F.E.) program. So, how did Starbucks manage to grow to where it is presently? And where does it stand in terms of financials and consumer preferences? Know all of this in this post.
Continue reading to get the latest Starbucks statistics and trends as of 2026.
Starbucks Statistics 2026 (Top Picks)
- Starbucks operates over 41,129 stores across 80+ countries as of 2026.
- The company serves approximately 100 million global customers each week.
- Starbucks reported $37.2 billion in revenue in 2025, and it has increased slightly with 2.76% growth year-on-year.
- Starbucks accounts for about 1% of the global food service industry and roughly one-third of the global coffee shop market share.
- In the U.S., cold beverages now make up about 75% of Starbucks’ drink sales, up from roughly 37% a decade ago.
- Starbucks had about 34.2 million active Starbucks Rewards members in the U.S. as of 2026.
- In Q2 FY2026, Starbucks reported quarterly revenue of $9.5 billion with global comparable store sales growth of +6.2%, signaling a strong turnaround under the “Back to Starbucks” strategy.
Brief Overview of Starbucks
| Category | Details |
| Founded | 1971 in Seattle, Washington |
| Founders | Jerry Baldwin, Gordon Bowker, Zev Siegl |
| CEO | Brian Niccol |
| Global Presence | Over 41,129 stores in 80+ countries |
| Revenue (Q4 2025) | $9.5 billion |
| Net Income (Q3 2025) | $510.9 million |
| Employees | Approximately 381,000 globally |
| Starbucks Rewards Members | 34.2 million active members in the US |
| Top Markets | United States (16,944 stores), China (7,991 stores) |
How Many Starbucks Stores Are There?
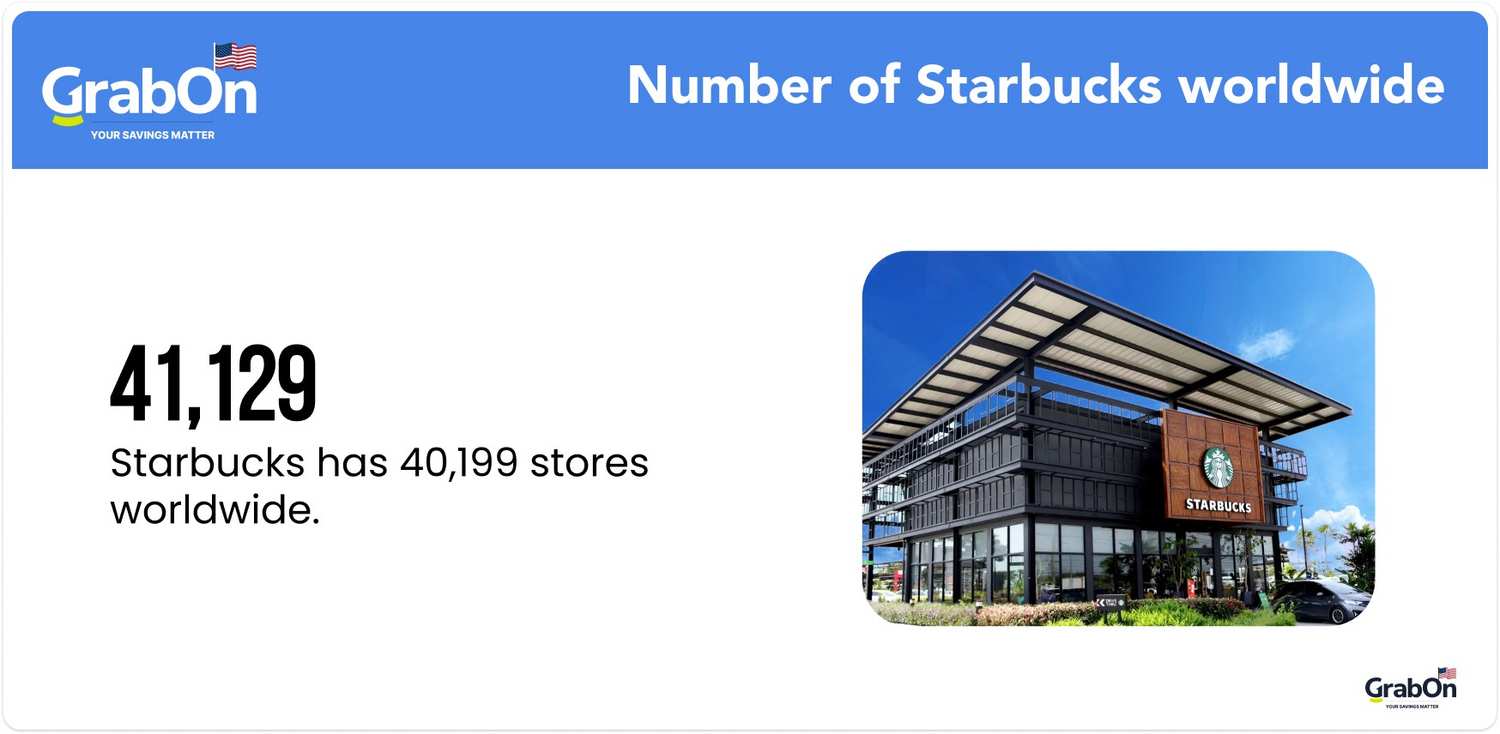
As of 2026, Starbucks has 41,129 stores worldwide. Of these, 52% are company-operated while 48% are licensed stores. The company opened 11 net new stores in Q2 FY2026, following a period of restructuring closures under the “Back to Starbucks” plan. The U.S. and China together account for 61% of Starbucks’ global store base, with 16,944 locations in the U.S. and 7,991 in China.
Explore the table below to see Starbucks’ global store count from 2011 to projected figures for 2030:
| Year | Number of Stores |
| 2030* | 55,000 |
| 2026 | 41,129 |
| 2025* | 40,990 |
| 2024 | 40,199 |
| 2023 | 38,038 |
| 2022 | 35,711 |
| 2021 | 33,833 |
| 2020 | 32,660 |
| 2019 | 31,256 |
| 2018 | 29,324 |
| 2017 | 27,339 |
| 2016 | 25,085 |
| 2015 | 23,043 |
| 2014 | 21,366 |
| 2013 | 19,767 |
| 2012 | 18,066 |
| 2011 | 17,003 |
Source: Statista, Starbucks Financial Releases
Number Of Starbucks Stores By Country
The US and China are Starbucks’ largest markets, comprising 61% of the company’s global portfolio. The company operates 60% of its US stores directly, i.e. 10,047 company-operated locations.
In contrast, all of Starbucks’ 2,077 stores in Korea are licensed, making it a fully franchised market. Additionally, Canada’s store distribution shows a similar trend, with about 67% of its stores being company-operated.
Below’s a breakdown of Starbucks’ store distribution by country, detailing company-operated versus licensed stores:
| Country | Company-operated stores | Licensed stores |
| United States | 10,047 | 6,813 |
| China | 8,009 | |
| Korea | 0 | 2,077 |
| Japan | 1,883 | |
| Latin America | 0 | 1,813 |
| Canada | 967 | 480 |
| United Kingdom | 524 | 900 |
| Turkey | 0 | 762 |
| Taiwan | 0 | 592 |
| Indonesia | 0 | 597 |
| Thailand | 0 | 550 |
| Philippines | 0 | 520 |
Source: Statista
Starbucks Market Distribution
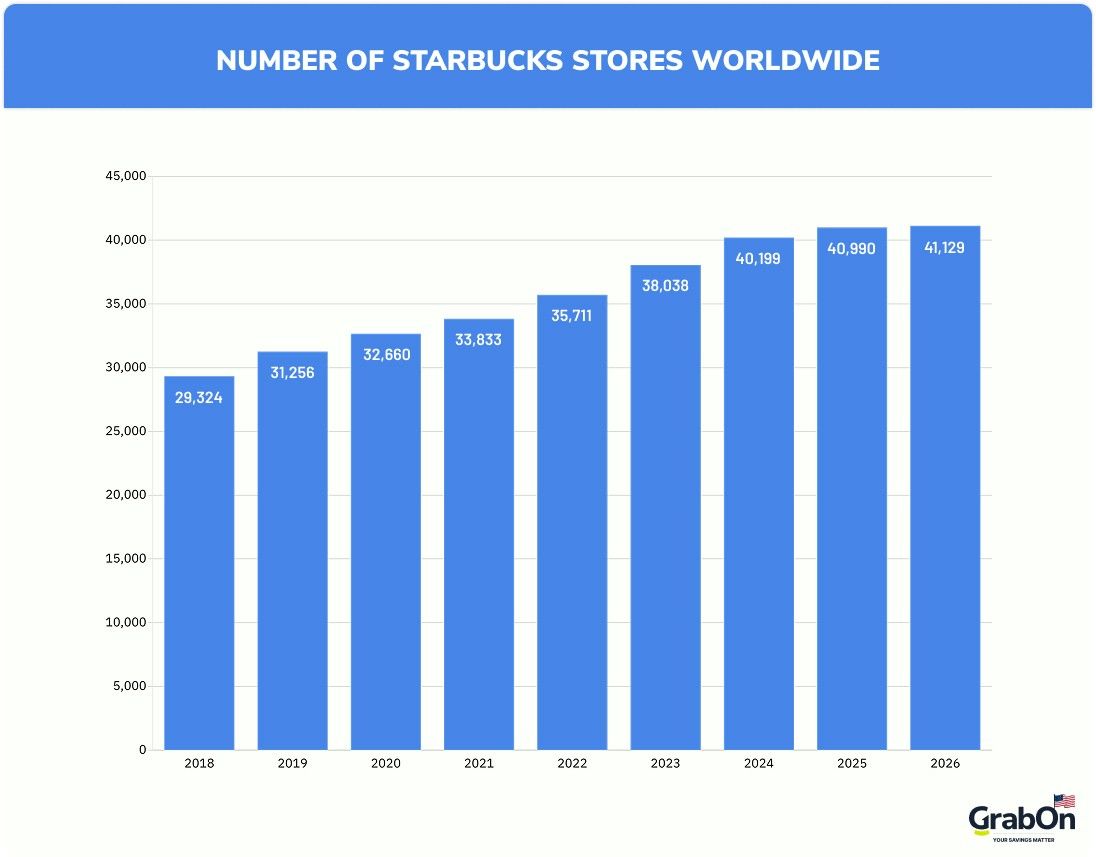
As of Q2 FY2026, Starbucks operates 41,129 stores worldwide, with over 2,000 more international locations than in North America. The company’s global footprint expanded immensely, growing from 29,324 stores in 2018, a 40.25% increase.
In 2023, more than 53% of Starbucks stores were located outside the United States, with the Americas region, excluding North America, seeing a store count surge of over 300% from 2018 to 2023. However, in 2025, the percentage of Starbucks stores in North America will go down by 1%, as shared by the corporation.
| Year | Number of Starbucks Stores Worldwide |
| 2018 | 29,324 |
| 2019 | 31,256 |
| 2020 | 32,660 |
| 2021 | 33,833 |
| 2022 | 35,711 |
| 2023 | 38,038 |
| 2024 | 40,199 |
| 2025 | 40,990 |
| 2026 | 41,129 |
Source: Statista
How Many Customers Does Starbucks Have?
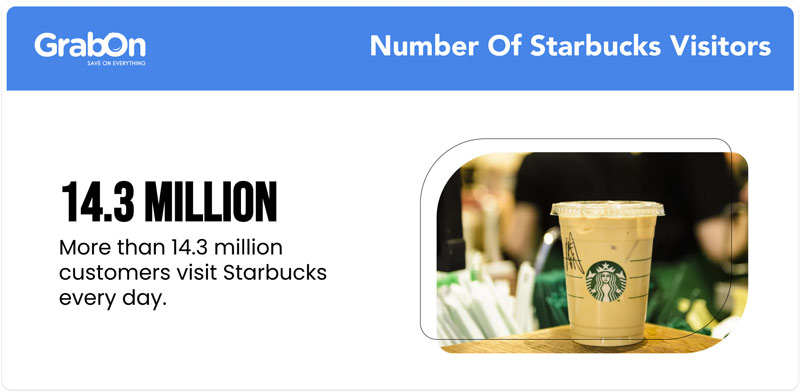
Starbucks serves approximately 100 million customers globally each week, translating to an average of 14.3 million customers daily. 80% of Starbucks customers are loyal enough to make it a weekly ritual to sip on their favorite brew.
Around 37.8 million Americans visit Starbucks every month. It remains the top coffee chain globally, with sales amounting to approximately $31.6 billion. Meanwhile, Dunkin’ ranked second with $11.9 billion in sales.
What Percentage of Starbucks Customers Are Female?
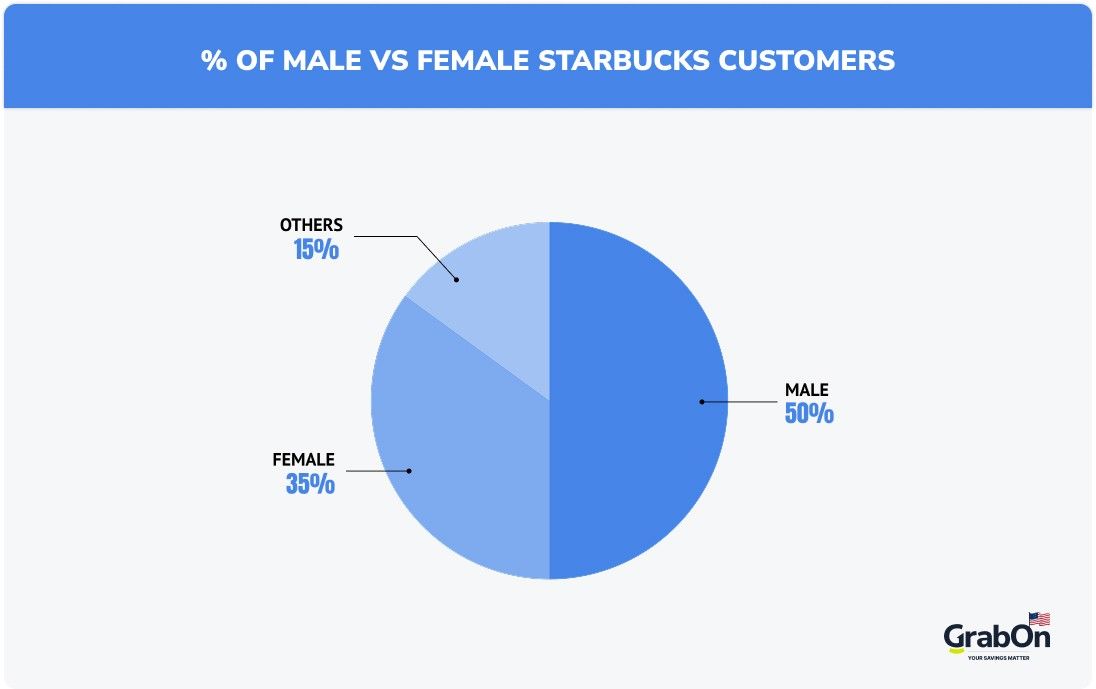
Shockingly, only 35% of Starbucks orders come from females, whereas approximately 50% of the orders come from male customers. A small percentage of the customers identify as “Others.”
Source: Medium
Starbucks Market Segmentation
Starbucks attracts a diverse customer base, primarily between the ages of 22 and 60, with an average age of 42. Its customers are both men and women who are highly educated and earn over $90,000 annually.
The table below highlights Starbucks’ market segmentation by age, geography, and customer focus:
| Market Segment | Target Demographic | Key Focus |
| Age | 22 – 60 | Broad age range including working adults and students |
| Geographic | Latin America, US, Canada, Middle East, Europe, China, Africa, Asia, Pacific | Extensive global reach with strategic locations |
| Psychographic | All societal classes | Emphasis on store experience, social responsibility, and environmental efforts |
Source: Latterly.org
Starbucks Rewards Program Statistics (Starbucks Loyalty Program)
Active US Starbucks Rewards membership totals 34.2% in the fourth quarter of fiscal year 2025, reflecting a 1.2% increase from the previous year.
Explore the latest stats on Starbucks Rewards’ quarterly membership growth in 2025:
| Quarter | Active Members |
| Q1 2025 | 34.6 million |
| Q2 2025 | 34.2 million |
| Q3 2025 | 33.9 million |
| Q4 2025 | 34.2 million |
Starbucks loyalty members spend 2-3 times more than non-members and visit more often. Rewards members are 5.6 times more likely to visit daily. Starbucks also enjoys a customer retention rate of 44%, compared to the industry average of 25%. Notably, rewards members account for over 50% of sales at company-operated stores.
Source: Gitnux, Businessdit,
Starbucks Annual Revenue
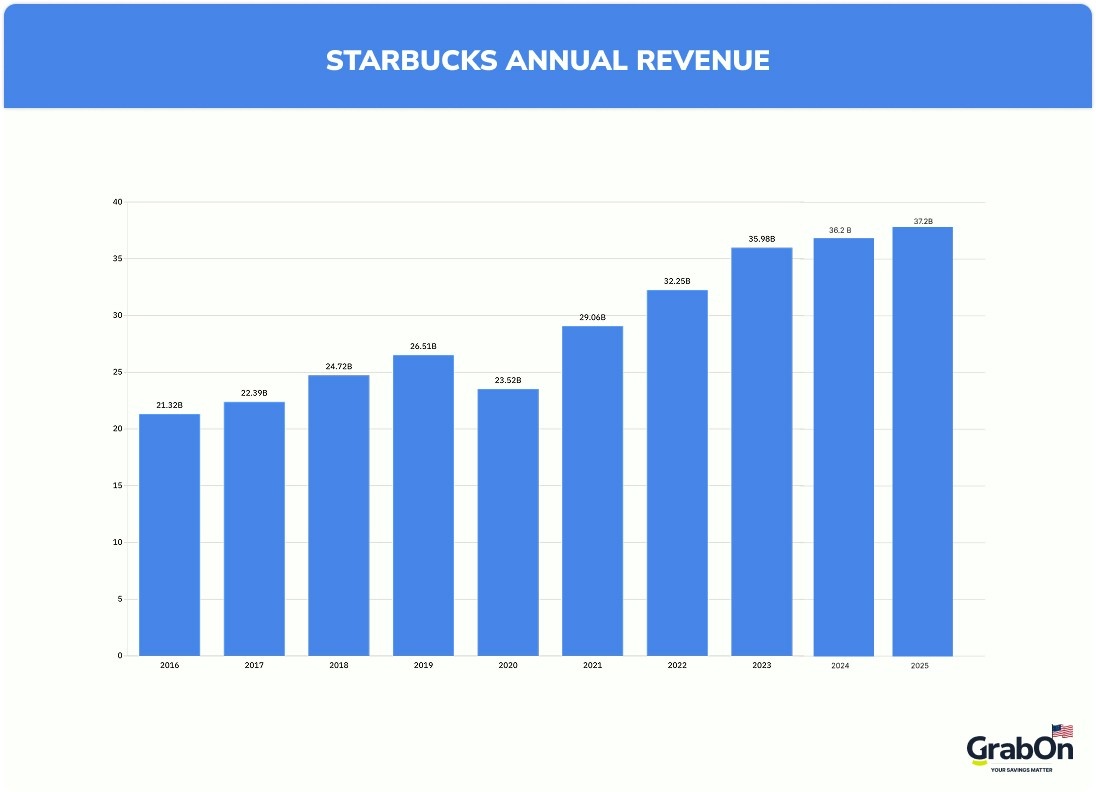
Starbucks reported a revenue of $37.2 billion in 2025. In 2024, Starbucks made $36.2 billion in revenue, marking a 2.8% growth year over year. For FY2025, diluted EPS was $1.63, down from $3.31 in FY2024, primarily due to restructuring costs under the “Back to Starbucks” plan.
Source: Starbucks Financial Releases
Starbucks’ Quarterly Revenue
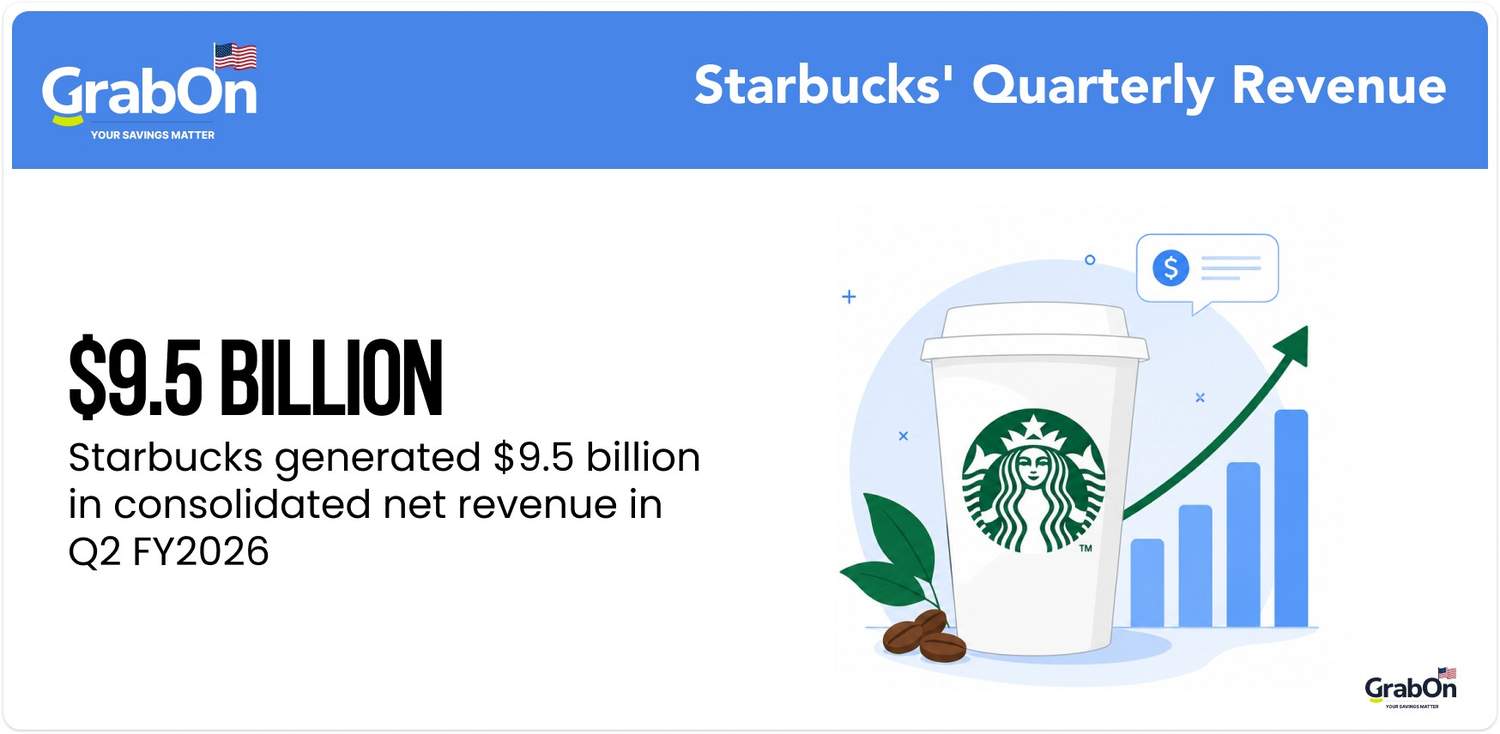
In Q2 FY2026 (quarter ended March 29, 2026), Starbucks generated $9.5 billion in consolidated net revenue, a 9% increase year-over-year. This was driven by a 6.2% increase in global comparable store sales and net new store growth. Over the last twelve months, the company’s revenue reached $37.2 billion, marking a 2.8% year-over-year growth.
Source: Stock Analysis, Starbucks Financial Release
Starbucks Market Share
Starbucks commands a leading market position with a 29.48% market share as of Q3 2025. Although this is slightly down from 30.08% in Q2 2025.
In comparison, McDonald’s holds a 21.81% share, and Chipotle Mexican Grill has a 9.25% share. Starbucks strongly outperforms competitors like Yum Brands Inc. and Restaurant Brands International, with their respective shares of 6.10% and 7.54%.
Check out the table below for the latest market share stats for Starbucks and its competitors:
| Company | Market Share (MRQ Q3 2025) | Market Share Q2 2025 |
| Starbucks Corporation | 29.48% | 30.08% |
| McDonald’s Corporation | 21.81% | 21.77% |
| Chipotle Mexican Grill | 9.25% | 9.74% |
| Yum China Holdings Inc | 9.88% | 8.86% |
| Restaurant Brands International Inc | 7.54% | 7.67% |
| Yum Brands | 6.10% | 6.15% |
| Luckin Coffee Inc | 3.79% | 0.00% |
| The Cheesecake Factory | 2.79% | 3.04% |
| Wendy’s Company | 1.69% | 1.78% |
Source: CSIMarket
Source: CSIMarket
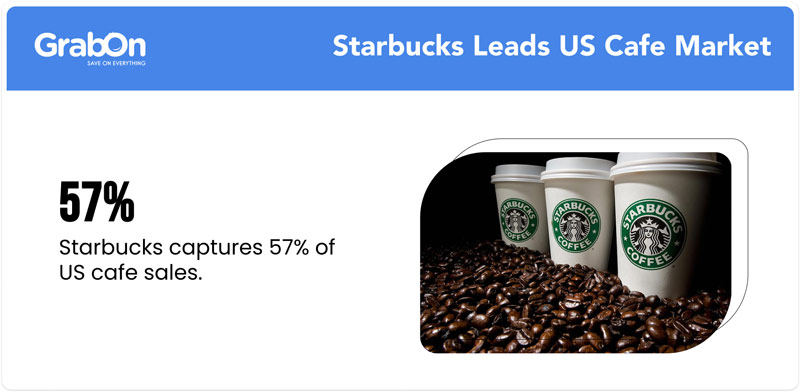
Starbucks is a hugely popular brand worldwide, but it’s especially successful in the US. In fact, 57% of all cafe sales in the US come from Starbucks, meaning it holds about two-thirds of the market share. If you’re a regular coffee drinker, you can save on your favorite drinks and snacks by using the latest McDonald’s coupons available on GrabOn, which often feature discounts on beverages, seasonal specials, and combo offers.
Starbucks Workforce Statistics
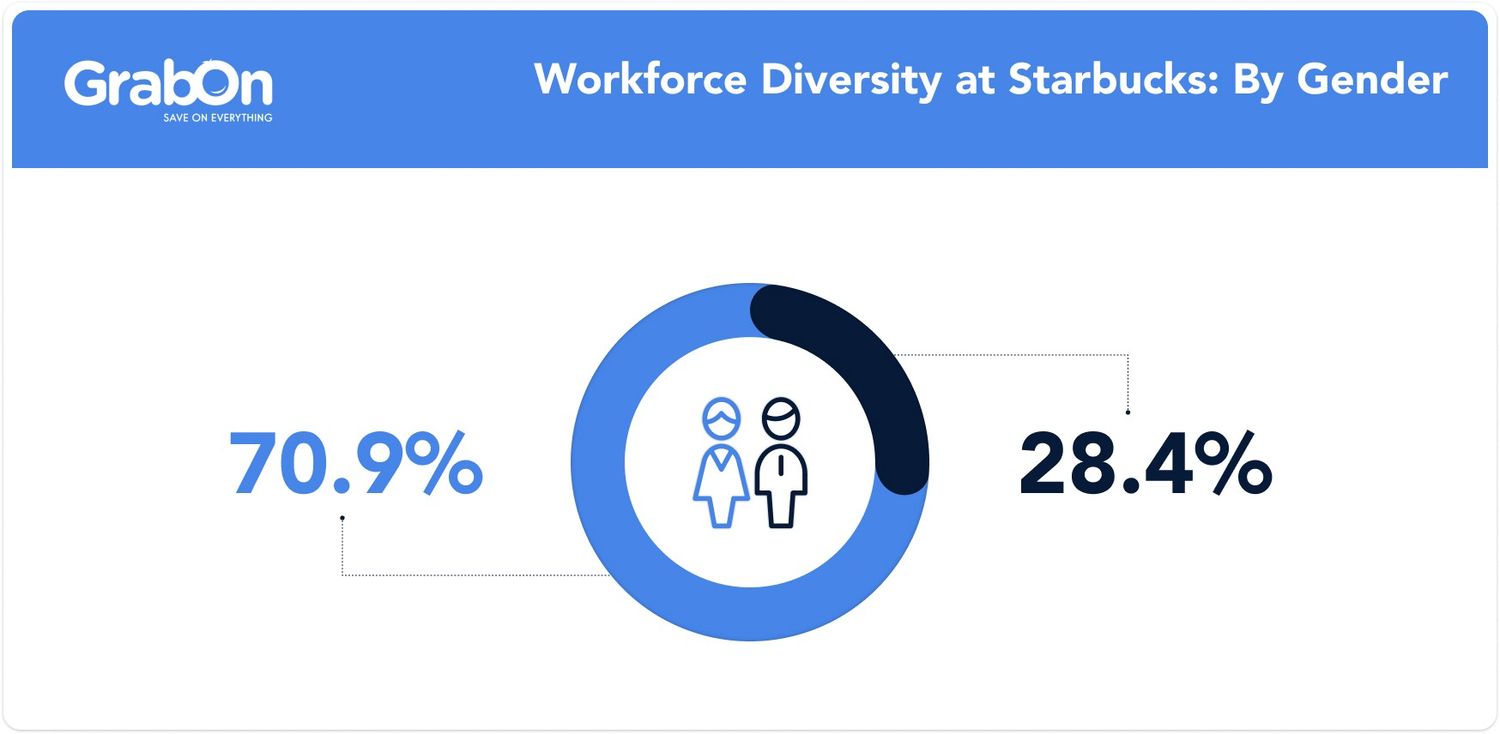
At Starbucks, the workforce is predominantly female, with 70.9% of employees identifying as female and 28.4% as male. The racial and ethnic composition of Starbucks employees is diverse.
Source: Starbucks Stories
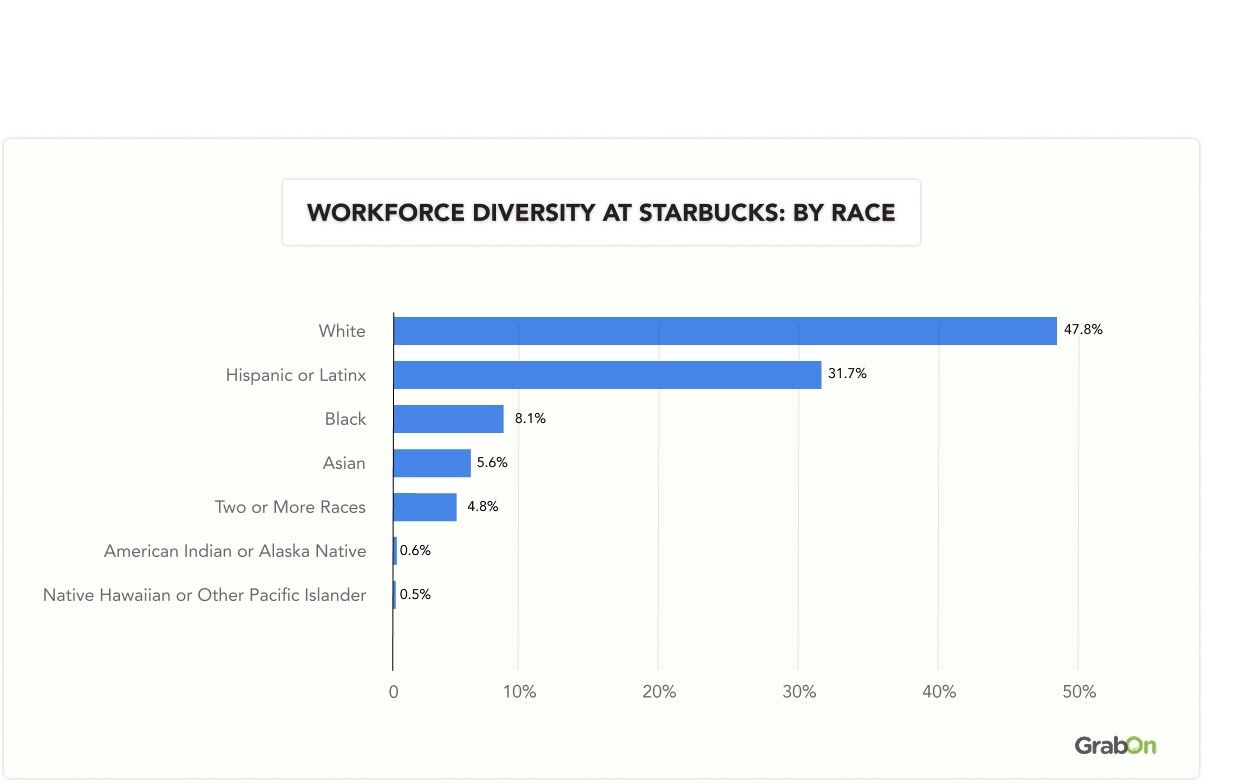
When it comes to race, Starbucks’ workforce is made up of 47.8% White, 31.7% Hispanic or Latino, 8.1% Black, 5.6% Asian, 4.8% Two or More Races, 0.6% American Indian or Alaskan Native, and 0.5% Native Hawaiian or Other Pacific Islander.
Source: Starbucks Stories
Comparable Store Sales Trends
In Q2 FY2026, Starbucks delivered global comparable store sales growth of +6.2%, driven by a 3.8% increase in comparable transactions and a 2.3% increase in average ticket. This marks a dramatic turnaround from the negative comparable sales trends seen throughout most of fiscal 2024 and into early fiscal 2025.
In North America, comparable store sales surged 7.1%, driven by a 4.4% rise in transactions and a 2.6% increase in ticket. Internationally, comparable store sales grew 2.6%, while China posted a modest 0.5% gain, driven by a 2.1% increase in transactions partially offset by a 1.6% decline in average ticket.
| Region | Comparable Store Sales (Q2 2024) | Comparable Transactions | Average Ticket |
| Global | +6.2% | +3.8% | +2.3% |
| North America | +7.1% | +4.4% | +2.6% |
| International | +2.6% | +2.1% | +0.5% |
| China | +0.5% | +2.1% | -1.6% |
Source: Starbucks Q2 FY2026 Earnings Release.
Impact Of New Store Formats
Starbucks continues to innovate with new store formats to better meet evolving customer preferences. These formats include drive-thru, mobile order, and delivery-only stores:
- Drive-thru stores represent 80 to 90% of Starbucks’ new U.S. openings in recent years.
- Mobile orders now make up 30% of total transactions in the US, reflecting the convenience and speed of the Starbucks app.
Sources: Starbucks Long-Term Growth Strategy
Starbucks China Joint Venture
In April 2026, Starbucks announced the closing of its joint venture with Boyu Capital to operate Starbucks retail in China. Under the terms, funds managed by Boyu Capital now hold a 60% stake in Starbucks China retail operations, while Starbucks retains a 40% ownership interest and continues to own and license the brand and intellectual property to the joint venture. This marks a significant shift in Starbucks’ China strategy, moving from fully company-operated to a JV-licensed model.
Source: Starbucks Q2 FY2026 Earnings Release
Best Selling Products At Starbucks
Cold coffee drinks are a major driver of sales at Starbucks, accounting for 75% of total sales. The Cold Brew is the most popular coffee drink, surpassing the Cafe Mocha in sales.
The Pumpkin Spice Latte remains a top favorite, generating $7 billion in sales in 2022. New seasonal offerings like the Iced Apple Crisp Oat Milk Macchiato and the Iced Pecan Crunch Latte Oatmilk are also gaining popularity.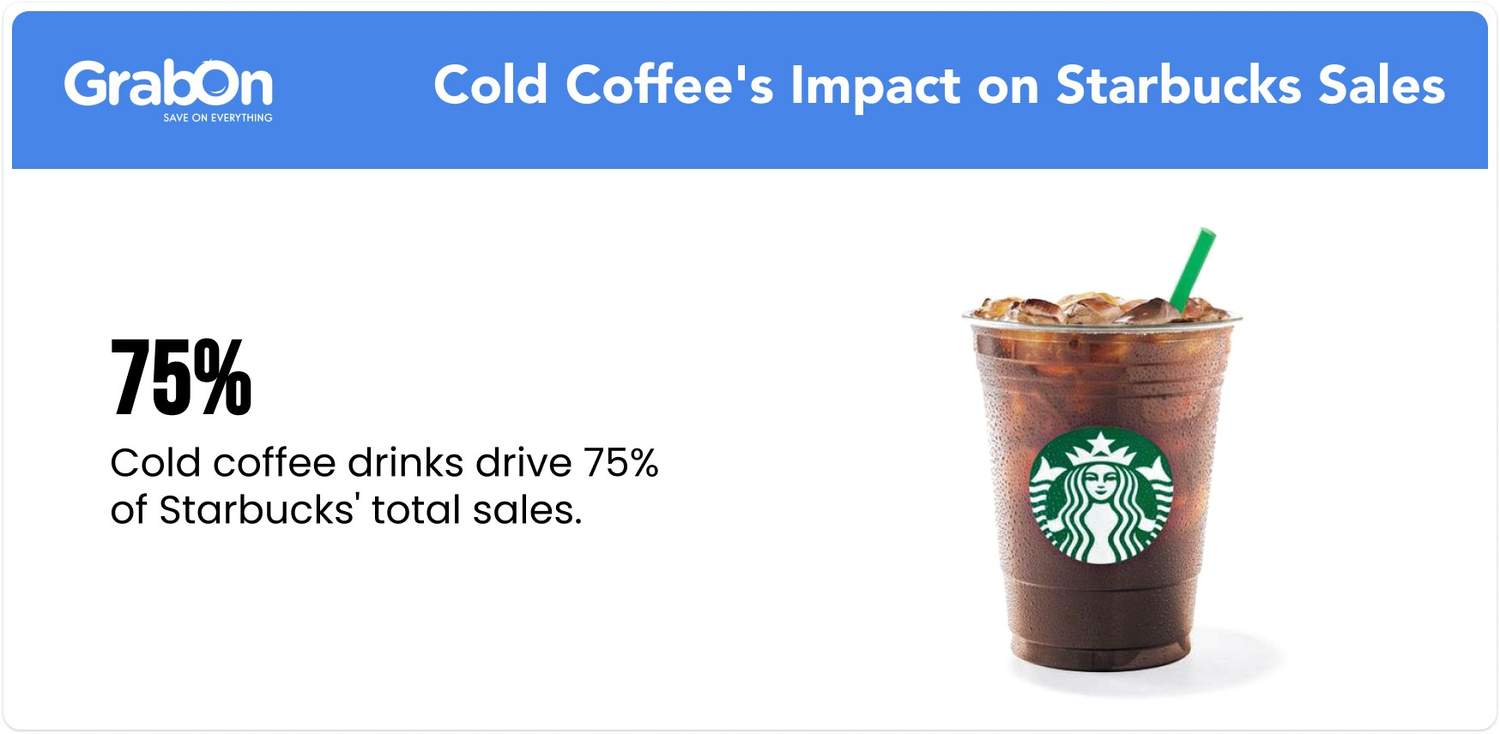
In 2024, Starbucks introduced new items such as the non-dairy Vanilla Sweet Cream Cold Foam and Vanilla Sweet Cream, both made with oat milk and soymilk, catering to the increasing demand for plant-based options. The launch of plant-based and seasonal drinks has driven a 45% year-over-year increase in sales for oat milk beverages.
Fiscal Year 2026 Guidance
Starbucks has raised its FY2026 guidance following strong Q2 results. The company now expects global and U.S. comparable store sales growth of 5.0% or greater (up from a prior 3% target), non-GAAP EPS in the range of $2.25 to $2.45, consolidated net revenues roughly flat year-over-year (reflecting the China JV transition), and approximately 600 to 650 net new coffeehouses globally.
Source: Starbucks Q2 FY2026 Earnings Release