Instacart Statistics 2025: Usage & Revenue

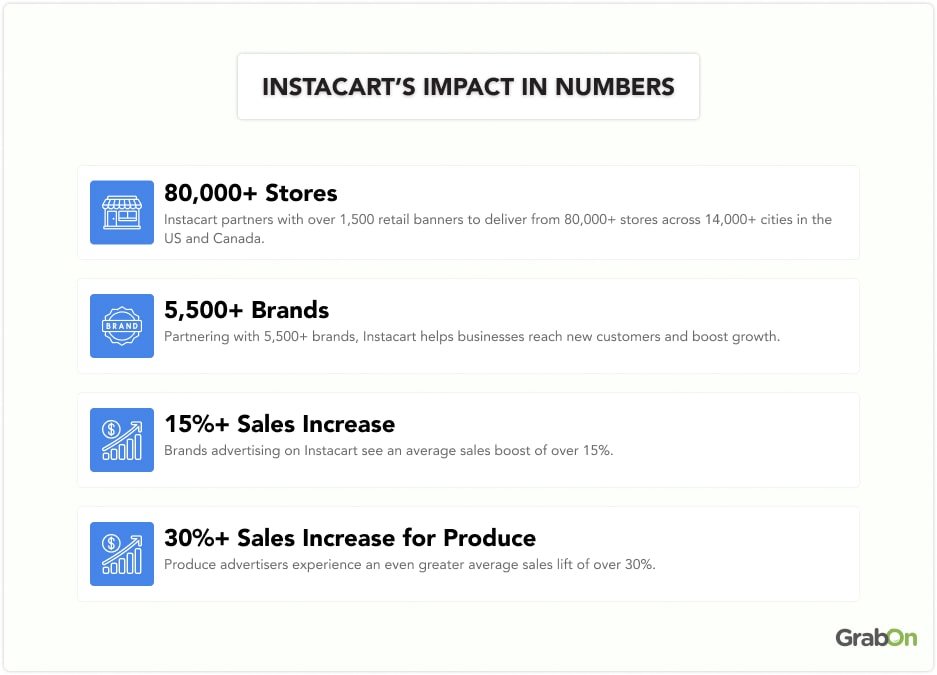
It’s been over a decade since Instacart started and since then, the platform has grown significantly and now partners with 1,500+ retail brands, serving more than 80,000 stores across 14,000 cities in the US and Canada.
Today, 25 million active users rely on Instacart for their grocery needs. Brands that advertise on Instacart see an average sales boost of over 15%, while the platform achieved a revenue of $3.37 billion in 2024.
In this blog, we'll explore key statistics and trends for Instacart in 2025, offering a detailed look into its user demographics, revenue, market positioning, and shopper dynamics to thoroughly understand the platform's current status.
Instacart Statistics (Top Picks)
- Instacart’s order volume rose to 77.5 million in Q4 2024.
- In 2024, Instacart achieved $3.37 billion in revenue.
- Instacart’s average order value is $116.
- Instacart's order volume rose to 70.8 million in Q2 2024.
- In 2023, Instacart achieved $3.04 billion in revenue.
- Instacart holds a 21.6% market share in the US online grocery delivery market.
- The platform has 600,000 shoppers who earn an average of $20 per hour.

How Many Active Users Does Instacart Have?
Instacart currently serves around 25 million active users as of 2025. That is up by over 78% from the previous year.
In 2024, there were 16.2 million active users, a small 54% increase from the year before. Between 2019 and 2020, Instacart witnessed its most significant growth, with a huge 74.55% rise due to changes in consumer behavior during the COVID-19 pandemic.
Take a look at the table below to see the number of active Instacart users over the years:
| Year | Active Users |
| 2017 | 3.3 million |
| 2018 | 4.3 million |
| 2019 | 5.5 million |
| 2020 | 9.6 million |
| 2021 | 11.1 million |
| 2022 | 13.7 million |
| 2023 | 14.0 million |
| 2024 | 16.2 million |
| 2025* | 25.0 million |
Source: Business of Apps and Instacart
Instacart User Demographics
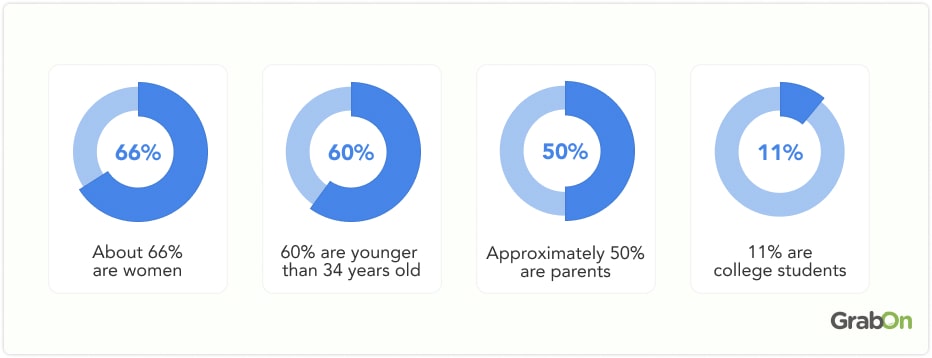
Instacart sees the highest usage among younger adults, particularly those aged 25 to 34, who comprise 28.24% of the platform’s users. Conversely, the platform is least popular among seniors, with only 8.73% of users being 65 or older.
The table below shows a detailed breakdown of Instacart users across various age groups:
| Age Group | Percentage |
| 18 to 24 | 10.19% |
| 25 to 34 | 28.24% |
| 35 to 44 | 20.13% |
| 45 to 54 | 18.11% |
| 55 to 64 | 14.61% |
| 65+ | 8.73% |
Source: SimilarWeb
As of 2024, most of Instacart’s users are female, making up 59.94% of the user base, while 40.06% are male. Nearly all of Instacart's traffic comes from the United States, accounting for 97.72%, with smaller numbers from Canada, Mexico, the United Kingdom, and India.
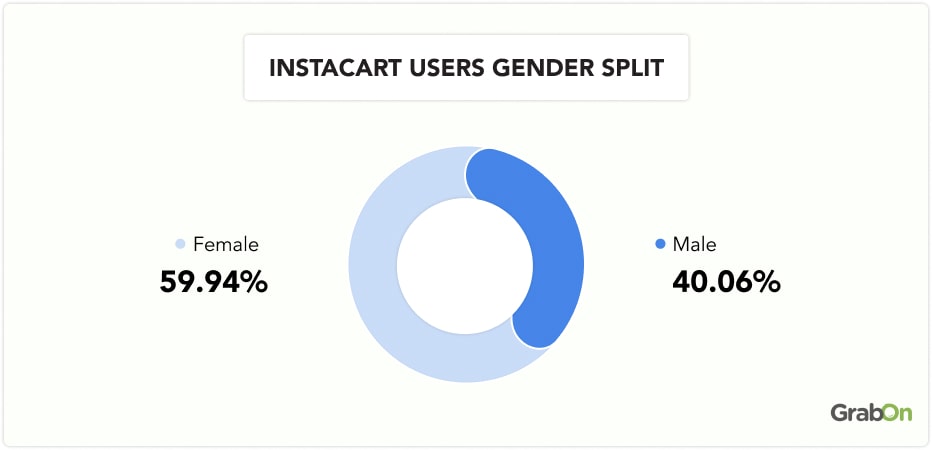
Source: SimilarWeb
Instacart Usage Statistics
Instacart users typically place between 2 to 3 orders each month. During the pandemic, there was a noticeable increase in the number of orders with more than 60% of customers placing at least one order per week.
See how Instacart’s metrics surged from pre-pandemic to pandemic peak across various categories:
| Metric | Pre-Pandemic | Pandemic Peak | Growth % |
| Weekly Sales | $100 million | $700 million | 600% |
| Daily Downloads | 20,000 | 324,000 | 1520% |
| Customers | 4 million | 9 million | 125% |
| Shoppers | 200,000 | 500,000 | 150% |
Source: Marketing Scoop
|
Source: Gitnux
Instacart Revenue By The Years
In 2024, Instacart achieved a revenue of $3.37 billion, a 10.85% increase from the $3.04 billion reported in 2023. The most significant revenue growth occurred in 2020, with earnings largely increasing by 590.19% to $1.48 billion, up from $214 million in 2019. This is the same time when the subscriber base of Instacart grew my the most significant margin due to the pandemic and lockdowns.
Check out the table below to see how Instacart’s revenue has evolved over the past few years:
| Fiscal Year End | Revenue | Growth |
| 2023 | $3.04 billion | 19.25% |
| 2022 | $2.55 billion | 39.09% |
| 2021 | $1.83 billion | 24.17% |
| 2020 | $1.48 billion | 590.19% |
| 2019 | $214.00 million | – |
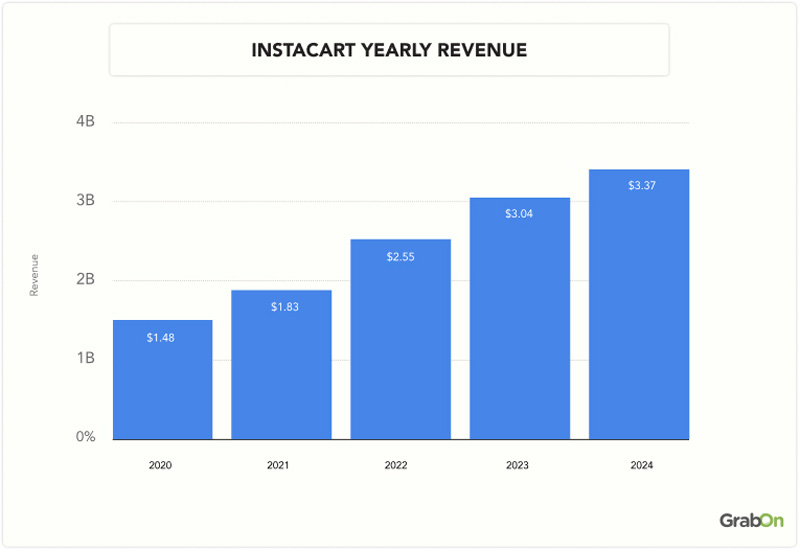
Source: Stock Analysis
Instacart Revenue By Quarter
In Q4 2024, Instacart’s revenue climbed to $883 million, a 3.63% rise from the $852 million reported in the previous quarter. This increase is owing to a broader trend of steady revenue growth.
Over the last twelve months, the company's total revenue amounted to $3.37 billion, showing a 10.85% year-over-year increase.
Explore the table below for a detailed look at Instacart's quarterly revenue trends:
| Quarter | Revenue |
| Q4 2024 | $883.00 million |
| Q3 2024 | $852.00 million |
| Q2 2024 | $823.00 million |
| Q1 2024 | $820.00 million |
| Q4 2023 | $803.00 million |
| Q3 2023 | $764.00 million |
| Q2 2023 | $716.00 million |
| Q1 2023 | $759.00 million |
| Q4 2022 | $757.00 million |
| Q3 2022 | $668.00 million |
| Q2 2022 | $621.00 million |
| Q1 2022 | $505.00 million |
| Q4 2021 | $475.00 million |
| Q3 2021 | $475.00 million |
| Q2 2021 | $444.00 million |
| Q1 2021 | $442.00 million |
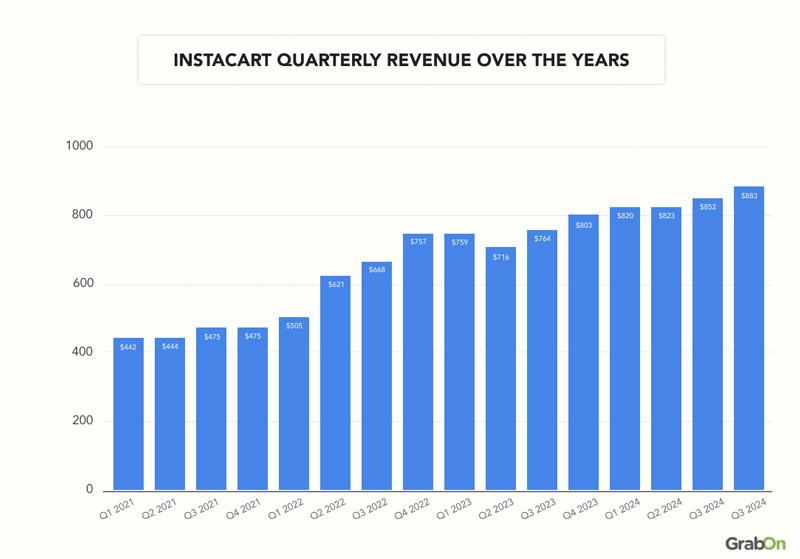
Source: Stock Analysis
Instacart's Q4 2024 Financial Highlights
In Q4 2024, Instacart's Gross Transaction Value (GTV) reached $8.64 billion, marking a 9.5% YoY increase. This growth was driven by a rise in order volume. Additionally, Instacart made a total revenue of $883 million, accounting for 10.21% of the GTV.
The revenue from transactions alone was $616 million, which is 7.12% of the GTV while advertising and other revenue totaled $228 million, making up 3.09% of the GTV.
Source: Instacart Investor Relations
Instacart's Market Share
As of 2025, Instacart holds a significant share of the US online grocery delivery market, holding 21.6% of the market share. This places Instacart as the third-largest player in the industry, behind Walmart which leads with a 25.7% share, and Amazon with 22%.
Explore the table below to see Instacart's market share compared to top retail competitors in 2025:
| Retailer | Market Share In 2025 |
| Walmart | 25.70% |
| Amazon | 22.0% |
| Instacart | 21.60% |
| The Kroger Co. | 9.90% |
| Target | 4.80% |
| Albertsons Companies | 3.40% |
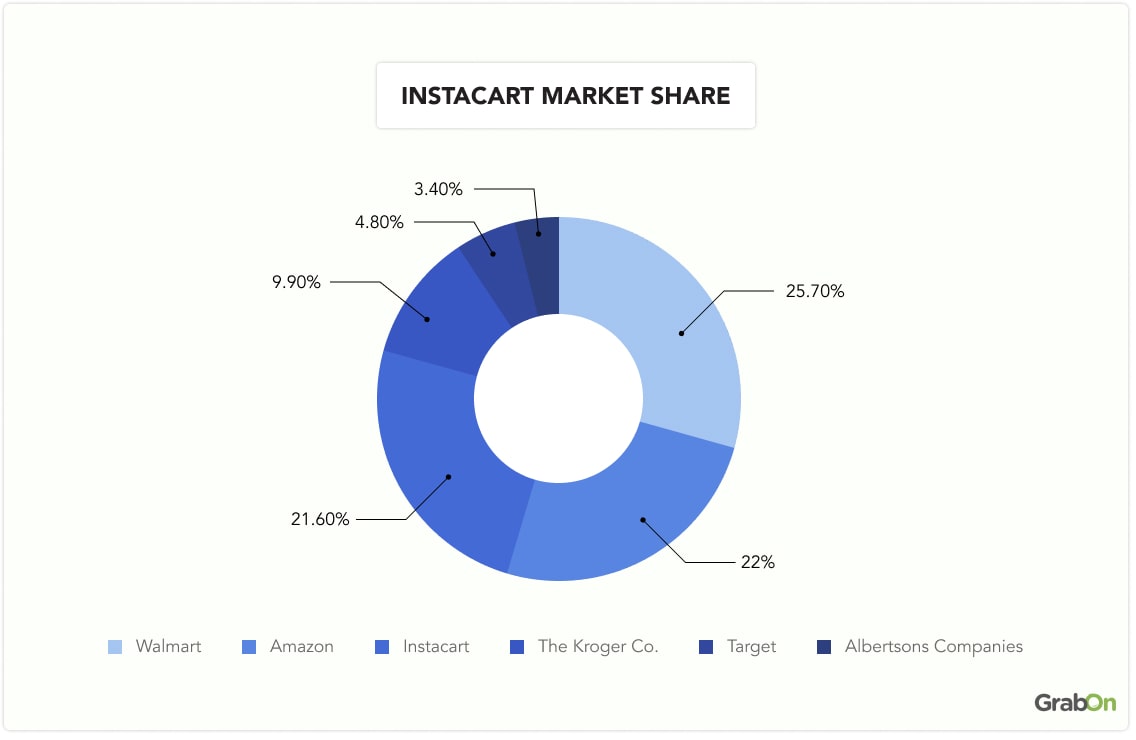
Instacart remains a key competitor, particularly due to its rapid growth during the pandemic years, which saw its market share more than double from 10.2% in 2019 to 21.5% in 2020.
Source: eMarketer
Instacart's Retailer and Brand Partnerships
Instacart’s extensive retailer network allows it to offer consumers a one-stop-shop experience with access to over 1 billion products. Major retailers on the platform include Kroger, Albertsons, Publix, Costco, Wegmans, and Aldi.
In 2021, Instacart committed $1 million each to support Black-owned and women-owned emerging CPG brands. The initiative has supported 250+ brands in 30 states with free advertising credits to help them grow.
Source: Instacart Economic Impact
Instacart Shopper Statistics
Instacart has over 600,000 shoppers who handle picking and delivering groceries to customers. These shoppers earn an average of $20 per hour and more than 80% use their own vehicles. On average, they complete 5 to 10 orders per day and typically stay with the platform for about 6 months.
Explore the table below for the growth of Instacart’s shopper community over the years:
| Year | Number of Shoppers |
| 2014 | 5,000 |
| 2016 | 20,000 |
| 2018 | 70,000 |
| 2019 | 130,000 |
| 2020 | 500,000 |
| 2021 | 600,000 |
Source: Business of Apps
Who Are Instacart Shoppers?
Instacart's shopper community is diverse, comprising college students, caregivers, retirees, and busy parents seeking flexible income. Over 80% value the independence that Instacart offers, and 68% have other income sources, using the platform for supplemental earnings.
Source: Instacart Economic Impact
Instacart’s Order Volume
In Q4 2024, Instacart saw a rise in order volume to 77.5 million, a 10.5% increase from last year. On average, Instacart processes 294 million orders annually, averaging around 24.5 million orders each month. This equates to approximately 558 orders per minute.
Take a look at the table below for a quick overview of Instacart's order-related statistics:
| Metric | Value |
| Annual Orders | 294 million |
| Monthly Orders | 24.5 million |
| Orders per Minute | 558 |
| Growth Since 2019 | 500%+ |
Source: Priori Data
Instacart Valuation Stats
In 2024, Instacart was valued at $8.9 billion, which is over 76% decrease from its peak valuation of $39 billion in 2021. This drop followed a surge during the pandemic, which led to a valuation of $13.7 billion in 2020. Despite the decline, the current valuation is still over four times higher than it was in 2016 at $2 billion.
Here's a table that highlights Instacart’s valuation journey from 2016 to 2024:
| Year | Valuation ($) |
| 2016 | 2 billion |
| 2017 | 3.4 billion |
| 2018 | 7.6 billion |
| 2020 | 13.7 billion |
| 2021 | 39 billion |
| 2022 | 24 billion |
| 2023 | 9.3 billion |
Source: Business of Apps
Wrapping Up
Instacart has changed the grocery shopping experience for customers while also supporting retailers in building their websites and apps. This allows businesses to connect with customers in new ways, such as introducing virtual convenience stores and offering nationwide delivery in just 30 minutes. Around 20% of Instacart orders now originate from its retail partners’ websites or apps. With the introduction of the Instacart Platform, retailers can now utilize advanced tools and technology to enhance their operations using Instacart’s expertise.